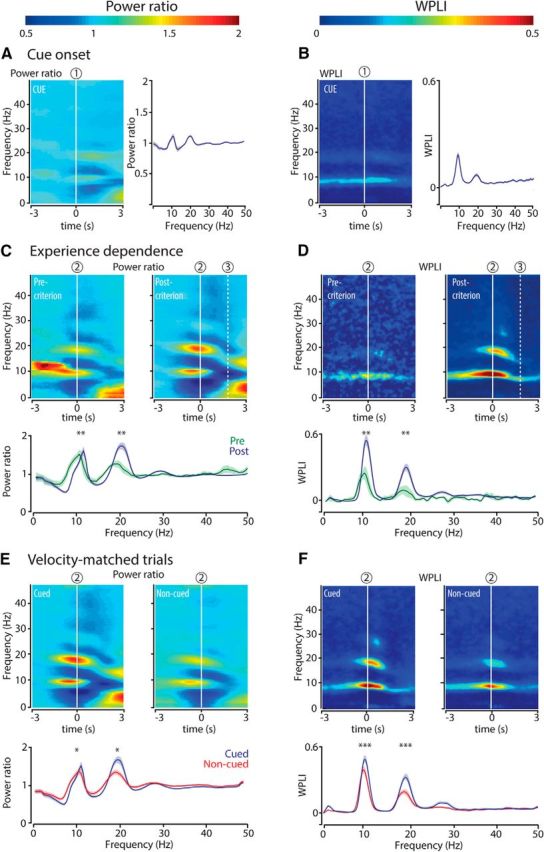
Figure 3.

Analyses controlling for synchronization to cue onset, experience dependence, and effects of locomotion velocity. A, Hippocampal theta and beta bad power and coherence are not strongly associated with cue onset. Left, Color-coded time-frequency plot of power of hippocampal LFPs averaged across all recording sessions and aligned to cue onset (1; n = 23 sessions). Right, Power ratio as a function of frequency (mean ± SEM) for cued approaches calculated over a time window of 1 s centered at cue onset. B, Same as in A but now for coherence (WPLI). Power and WPLI increases in the theta and beta band aligned to cue onset are weaker than the increases related to chamber entries (Fig. 1, 2), indicating that cue illumination does not account for the onset of the power and coherence increments observed near chamber entries. p < 0.01 (WMPSR). C, D, Strength of hippocampal theta and beta band power and coherence increases with experience. Top panels, Color-coded time-frequency plots represent power ratio (C) and WPLI (D), respectively, relative to chamber entry (2). Color scale is the same as in A, B. In precriterion sessions, rats approached the cued well in <90% of the trials (n = 8 sessions); whereas in postcriterion sessions, rats performed >90% of the trials correctly (n = 9 sessions). All of these sessions belonged to the primary cue conditioning phase, where every correct goal approach resulted in reward delivery. Bottom panels, Power ratio and coherence (mean ± SEM) as a function of frequency, for cued approaches centered at chamber entry (2). **p < 0.02 (WMPSR). E, F, Differences in running speed do not account for differences in hippocampal theta and beta band power and coherence between cued and noncued chamber entries. In a reanalysis of power and coherence, cued and noncued trials were velocity-matched by pairing cued trials to noncued trials from the same session showing the least mean velocity difference across an interval of 1 s surrounding chamber entry. Top panels, Time-frequency plots of power ratio (E) and WPLI (F) synchronized on chamber entry (2) for velocity-matched trials in cued and noncued conditions. Color scale is the same as in A, B. Bottom panels, The peak power ratio and peak coherence (mean ± SEM) in the theta and beta ranges (2) were significantly stronger for cued than for noncued approaches. *p < 0.03 (WMPSR). ***p = 10−4 (WMPSR). These results render the possibility that our results can be explained by a velocity difference between conditions unlikely.
