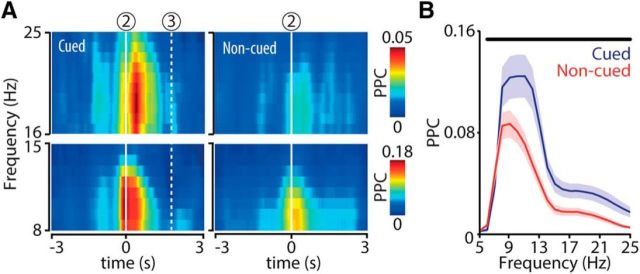
Figure 5.
Hippocampal phase locking to theta and beta band activity at cued chamber entries. A, Color-coded time-frequency plots represent mean spike-field coherence (PPC) across all recorded sessions (n = 23) aligned to chamber entry (2). Dashed line (3) indicates mean nose poke time relative to chamber entry. B, PPC distributions as a function of frequency (mean ± SEM) for cued (blue) and noncued (red) approaches calculated over a time window of 1 s centered at chamber entry. Horizontal black bar represents a significant difference between conditions (WMPSR; p < 0.05).

