Figure 6.
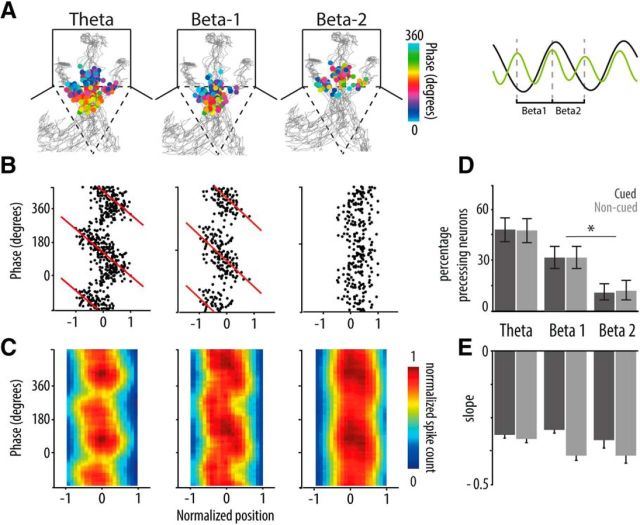
Hippocampal phase precession is not affected by reward expectancy. A, The spatial distributions of spike phases of a hippocampal neuron relative to cycles of theta (left), beta-1 (middle), and beta-2 (right). Right, Inset, Relation of beta-1 and beta-2 (green) with theta (black) in filtered and smoothed LFP traces. Spikes are plotted on top of the rat's trajectories (gray) to each of three fluid wells in the chambers and are color-coded for phase (peak of cycle is 0°; time interval: 4 s centered on chamber entry [dashed line]; all chambers are pooled (see Materials and Methods). Precession on theta and beta-1 appears as a gradual shift in color as the rat moves through the chamber toward the goal location. This example neuron does not show phase precession on beta-2. B, Firing phase of spikes as a function of linearized and normalized position of the example neuron shown in A. Red represents the fitted circular regression line, the slope of which indicates precession strength. C, Color-coded phase position plots represent the mean normalized spike density distribution per type of cycle across all neurons exhibiting significant precession in at least one of the three types (i.e., theta, beta-1, and/or beta-2). D, Percentage of significantly phase precessing CA1 units of a total of 194. Error bars indicate 2.5–97.5 percentile intervals based on a test of binomial proportion. *p < 0.05. The proportion of neurons precessing on beta-1 was significantly larger than that precessing on beta-2. E, Mean slope (± SEM) of the fitted regression lines of phase versus position for all significantly phase precessing units (WMPSR, not significant).

