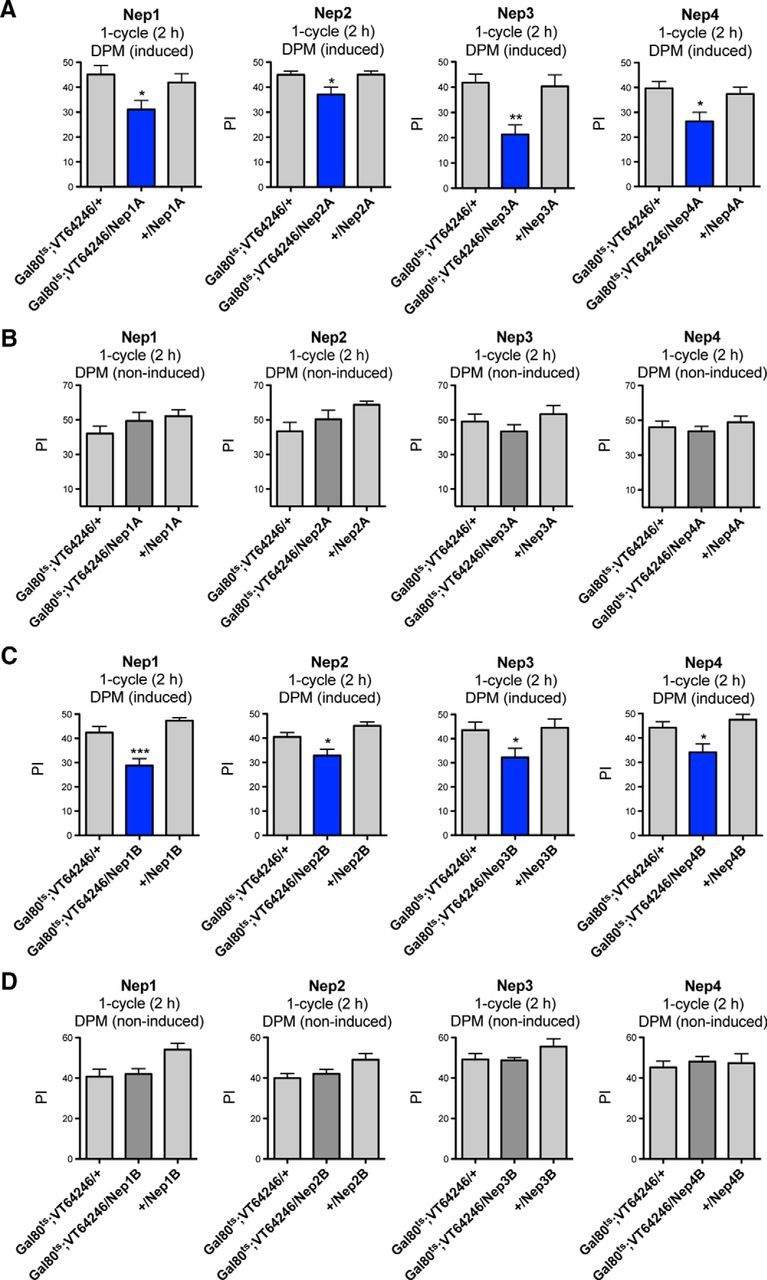
Figure 4.

Neprilysin inhibition in adult DPM neurons induces MTM deficits. A, B, MTM analyses of flies expressing RNAi-Nep(A) in adult DPM neurons. A, After 3 d of induction, Gal80ts;VT64246/Nep1A, /Nep2A, /Nep3A and /Nep4A flies exhibit MTM deficits compared with the genetic controls (Nep1A: F(2,73) = 4.125, p = 0.0202, n ≥ 23, post hoc Newman–Keuls test, Gal80ts;VT64246/Nep1A vs Gal80ts;VT64246/+ *p < 0.05, Gal80ts;VT64246/Nep1A vs +/Nep1A *p < 0.05; Nep2A: F(2,34) = 4.729, p = 0.0159, n ≥ 11, post hoc Newman–Keuls test, Gal80ts;VT64246/Nep2A vs Gal80ts;VT64246/+ *p < 0.05, Gal80ts;VT64246/Nep2A vs +/Nep2A *p < 0.05; Nep3A: F(2,28) = 8.327, p = 0.0016, n ≥ 9, post hoc Newman–Keuls test, Gal80ts;VT64246/Nep3A vs Gal80ts;VT64246/+ **p < 0.01, Gal80ts;VT64246/Nep3A vs +/Nep3A **p < 0.01; Nep4A: F(2,73) = 5.493, p = 0.0061, n ≥ 24, post hoc Newman–Keuls test, Gal80ts;VT64246/Nep4A vs Gal80ts;VT64246/+ **p < 0.01, Gal80ts;VT64246/Nep4A vs +/Nep4A *p < 0.05). B, Noninduced flies show similar MTM scores to the genetic controls (Nep1A: F(2,26) = 1.300, p = 0.2910, n ≥ 8; Nep2A: F(2,26) = 2.942, p = 0.0720, n ≥ 7; Nep3A: F(2,35) = 1.323, p = 0.2801, n = 12; Nep4A: F(2,58) = 0.5983, p = 0.5532, n ≥ 19). C, D, MTM analyses of flies expressing RNAi-Nep(B) in adult DPM neurons. C, After 3 d of induction, Gal80ts;VT64246/Nep1B, /Nep2B, /Nep3B and /Nep4B flies exhibit significantly lower MTM scores than the genetic controls (Nep1B: F(2,41) = 17.03, p < 0.0001, n = 14, post hoc Newman–Keuls test, Gal80ts;VT64246/Nep1B vs Gal80ts;VT64246/+ ***p < 0.001, Gal80ts;VT64246/Nep1B vs +/Nep1B ***p < 0.001; Nep2B: F(2,39) = 9.124, p = 0.0006, n ≥ 12, post hoc Newman–Keuls test, Gal80ts;VT64246/Nep2B vs Gal80ts;VT64246/+ *p < 0.05, Gal80ts;VT64246/Nep2B vs +/Nep2B ***p < 0.001; Nep3B: F(2,44) = 3.669, p = 0.0340, n ≥ 13, post hoc Newman–Keuls test, Gal80ts;VT64246/Nep3B vs Gal80ts;VT64246/+ *p < 0.05, Gal80ts;VT64246/Nep3B vs +/Nep3B *p < 0.05; Nep4B: F(2,53) = 6.527, p = 0.0030, n ≥ 15, post hoc Newman–Keuls test, Gal80ts;VT64246/Nep4B vs Gal80ts;VT64246/+ *p < 0.05, Gal80ts;VT64246/Nep4B vs +/Nep4B **p < 0.01). D, Noninduced flies show normal MTM scores (Nep1B: F(2,30) = 5.178, p = 0.0122, n ≥ 10, post hoc Newman–Keuls test, Gal80ts;VT64246/Nep1B vs +/Nep1B *p < 0.05; Nep2B: F(2,33) = 3.422, p = 0.0454, n ≥ 10; Nep3B: F(2,32) = 1.703, p = 0.1993, n = 11; Nep4B: F(2,33) = 0.1703, p = 0.8442, n ≥ 10).
