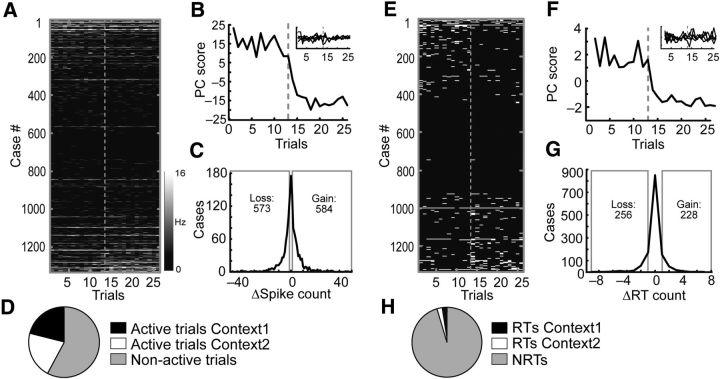
Figure 4.
Quantification of the neuronal responses to actions during the context-switch sessions. A, Raw spike counts for all neurons recorded during eight context-switch sessions. Each dash represents the spike count of a neuron in the period surrounding an action. A case is the sum across all 26 trials for one neuron for one of the three actions (444 neurons × 3 actions = 1332 cases). The sorting order was the same in A and E and was based on the difference in RT counts of the neurons across trials for the same action in the two contexts. The gray dotted line separates the 13 trials in Context 1 from the 13 trials in Context 2. B, PCA was performed on the matrix of raw spike counts in A. PC1 exhibited an abrupt transition between the last trial of Context 1 and the first trial of Context 2. PC2–PC6 are shown in the inset. C, Distribution of counts of cases in which raw spike counts changed across trials in Context 1 versus 2. Cases losing spikes are on the left of the distribution (n = 573) while cases gaining spikes (n = 584) are on the right. The gains and losses were not significantly different, indicating that the context changes were highly balanced across the population. D, Pie chart illustrating the relative proportions of active trials (trials with nonzero spike counts) in each context versus the proportion of nonactive trials (trials with zero spike counts). E, Distribution of RTs plotted in an identical manner to A. Each trial was classified as an RT or an NRT based on the difference in spike counts for the action periods relative to the baseline periods (data not shown) for each neuron. F, When PCA was performed on the RT matrix in E, PC1 exhibited an abrupt transition just after the context switch. PC2–PC6 are shown in the inset. G, Distribution of counts of cases in which RT counts changed across trials in Context 1 versus 2. Cases losing RTs are on the left of the distribution (n = 256) while cases gaining RTs (n = 228) are on the right. The gains and losses were not significantly different. H, Pie chart illustrating the relative proportions of RTs in each context versus the proportion of NRTs.

