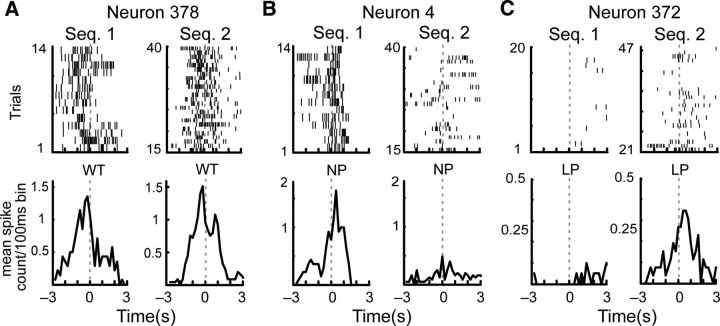
Figure 6.
Examples of the various responses of individual neurons to actions performed across sequences on the sequence-switch sessions. A, A neuron that responded similarly when the rat performed WTs in the two sequences. B, A different neuron that responded to NPs in Sequence 1 but not 2. C, A third neuron that responded to LPs but only in the second sequence. In each case, raster plots are shown in the top panels and peristimulus time histograms in the bottom panels. The action occurred at time 0.

