Figure 8.
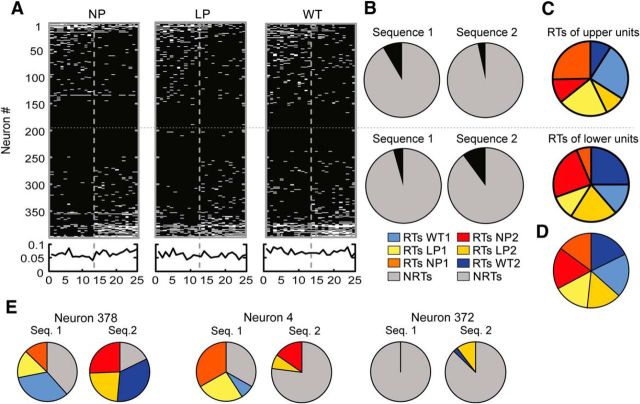
Cross-sequence changes in RTs for the three actions. A, Top, Distributions of RTs for each of the three actions across the population. Left, RTs for NPs. Middle, RTs for LPs. Right, RTs for WTs. The sorting order was identical to that used in Figure 7 and was maintained for all three panels. Bottom, RT probability or the average RT count/trial across all neurons. The vertical gray dotted lines in each panel denote the context switch point, whereas the single vertical dotted line separates the population of neurons in half. B, Pie charts illustrating the relative proportions of RTs (black) and NRTs (gray) for each half of the population in each sequence. Note that neurons in the top half exhibited relatively more RTs in Sequence 2 than 1, whereas those in the bottom exhibited the opposite pattern. C, Pie charts illustrating the distribution of RTs by action type for the top and bottom halves of the population. The color key can be found at the bottom of B. Each half of the population exhibited different proportions of RTs for WT1, LP1, and NP1 from Sequence 1, and for NP2, LP2, and WT2 from Sequence 2, executed in the order listed respectively. D, When the two halves of the population were recombined, the proportions of RTs dedicated to each action were similar in each sequence. E, Pie charts showing the distributions of RTs for the three individual neurons whose rasters were shown in Figure 6. The neuron number corresponds to its position in A.

