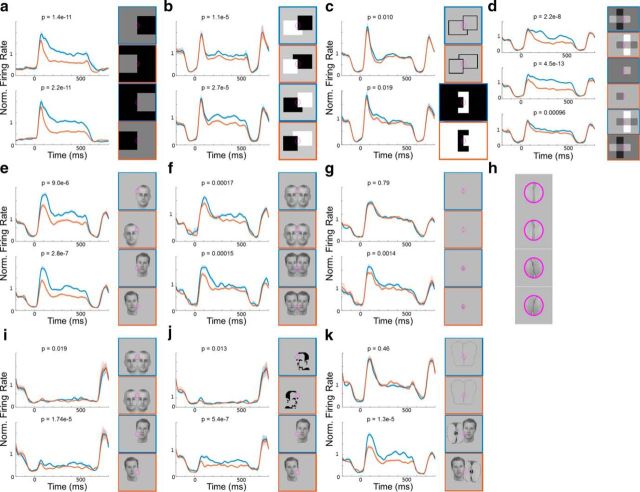
Figure 5.
Responses of border-ownership cells to simple and natural stimuli. Left, The PSTHs represent the population mean responses (±1 SEM, shaded region) of 50 selected border-ownership cells to stimuli shown on the right outlined with the corresponding color. Both artificial and natural stimuli were rotated and positioned such that the central edge (indicated by purple ellipse) was in the preferred orientation and centered on the receptive field of each cell. Preferred side of figure of border-ownership cells was determined based on the response to simple luminance squares (shown in a) alone. Blue represents conditions where the figure was on the preferred side. Red represents matched conditions where the stimulus looks identical/similar in the receptive field (purple ellipse) but the figure is on the nonpreferred side. The 50 cells were determined to be consistent border-ownership cells based on their responses to simple, artificial stimuli alone. p values were determined using two-tailed paired t tests. a, Population mean responses to luminance squares. A higher response to the preferred side is expected as the preferred side was determined based on the response to the luminance square. b, Population mean responses to occlusion stimuli. c, Population mean responses to occluding outlines and C-shapes. d, Population mean responses to four squares (top), single squares (middle), and transparent overlay (bottom). e, Population mean responses to single faces. f, Population mean responses to overlapping faces. g, Responses to isolated edge stimulus of faces alone. This stimulus was generated by removing the part outside the receptive field for stimuli in f. h, Magnified version of stimuli in g. i, Population mean responses to occluding and single faces with illusory contour, where the local stimulus inside the receptive field was removed. j, Population mean responses to Mooney faces (top) and to stimulus on bottom of f but with low-contrast border, where the contrast was reduced locally inside the receptive field (bottom). k, Population mean responses to outlines of occluding faces and faces occluding an apple.

