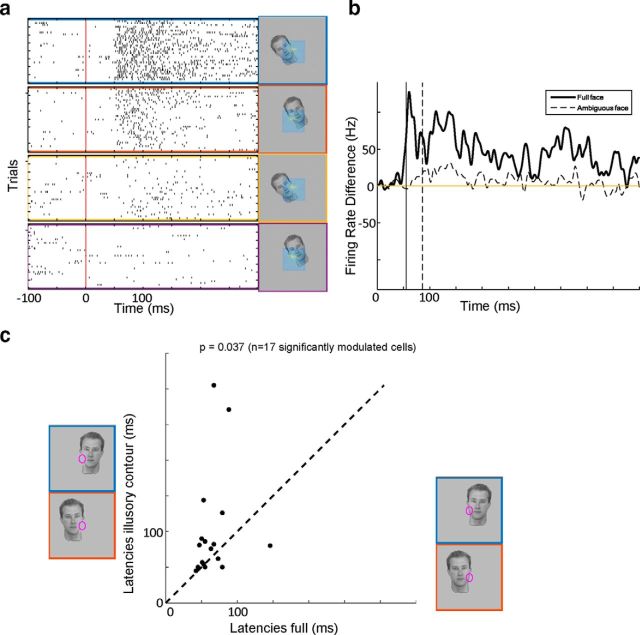
Figure 7.
Latency differences between full stimuli and stimuli with illusory contours. a, Raster plots of example cell responses to full faces presented on its preferred side (blue) and nonpreferred side (red), respectively, and responses to the stimulus with locally deleted edge (yellow and purple). The preferred side was defined by the cell's responses to luminance squares. b, Difference of the PSTHs for preferred side and nonpreferred side, for the full face (solid line) and the face with locally deleted edge (dashed line). Vertical solid and dashed lines indicate the latencies for full and ambiguous faces, respectively, defined as the time the difference reaches half its peak value. c, Population scatter plot of latencies of border-ownership signal of full face stimulus shown at the x-axis against border-ownership latency for the stimulus with locally deleted edge shown at the y-axis. p value was computed with a paired Wilcoxon rank sum test.

