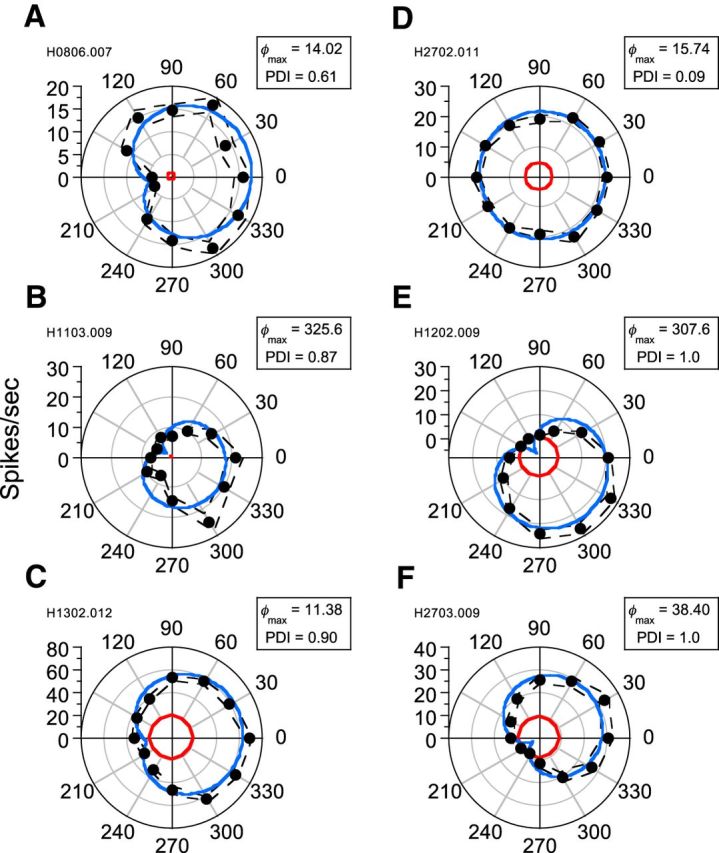
Figure 3.

Phase-dependent interactions for six representative neurons. Average spike frequency is plotted as a function of the spatial phase offset between response-equated LM and CM stimuli. Dashed black lines indicate ±1 SEM. Red lines show spontaneous activity. Data from each neuron have been fit (solid blue lines) with a descriptive function (Equation 6). Data from simple-type (B, E) and complex-type (A, C, D, F) cells are shown. Neurons displayed varying amounts of phase-dependent interaction. Phase offsets (φmax) corresponding to maximal responses and PDI are shown at the top right of each polar plot.
