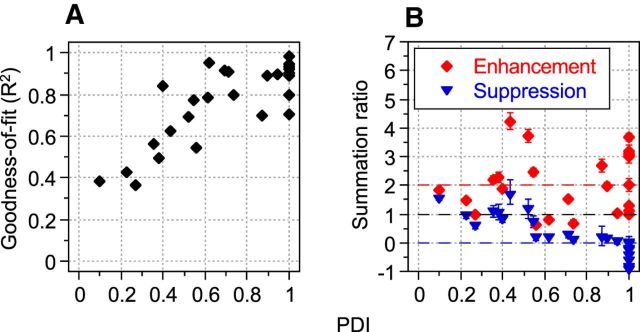
Figure 5.
Goodness-of-fit and summation ratios for phase-dependent interactions. A, R2 values derived from fitting Equation 6 to each neuron's responses to the combined LM and CM patterns plotted against the corresponding PDI values. Equation 6 best fit responses of neurons that exhibited a high degree of interaction with a well defined null phase (PDI values ∼ unity). B, Enhancement and suppression ratios (Equations 8 and 9, respectively) indicating neurons' responses to LM and CM stimuli in isolation compared with responses to their composite at φmax (enhancement ratio, red diamonds) and φmax − 180° (suppression ratio, blue triangles). An enhancement ratio of two (red dashed line) indicates that the Rmax of the cell is exactly twice as much as both stimuli together as to each in isolation (linear summation). A suppression ratio of zero (blue dashed line) indicates complete nulling of the neuron's response at Rmin. Different neurons exhibited a range of enhancement and suppression ratios not always consistent with simple linear summation. Error bars around each of these ratios indicate 68% confidence intervals (∼equivalent to ±1 SE) generated by a nonparametric, bias corrected and accelerated (BCa) bootstrapping technique that created 10,000 bootstrapped replications of each fitted function without assuming a Gaussian distribution for the raw data or the residuals (Efron and Tibshirani, 1993).

