
Figure 5.
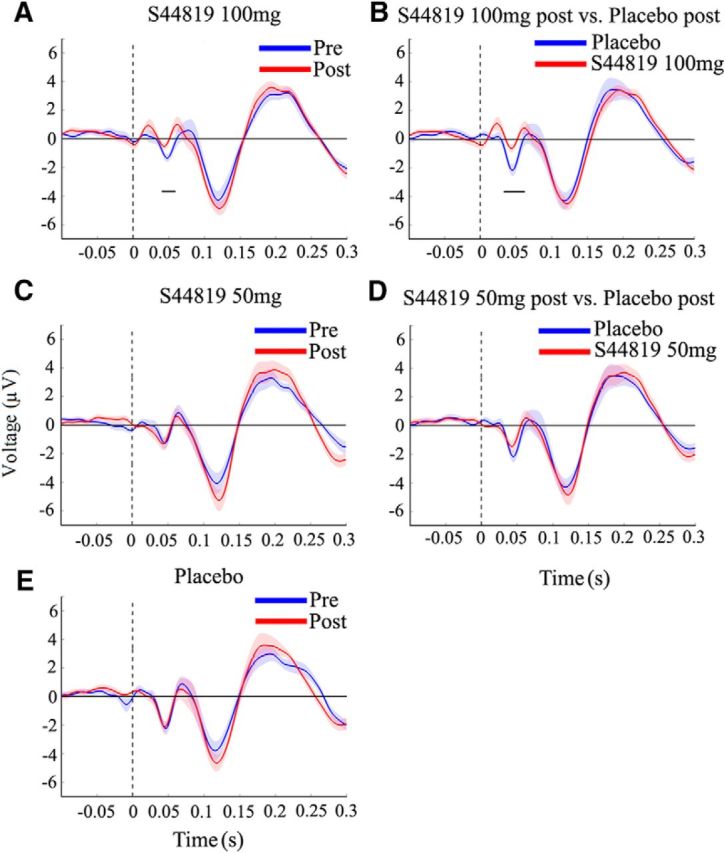
Grand-averaged TEPs (shadings: ±1 SEM) elicited by TMS of left M1 before (blue) versus after (red) intake of S44819 (100 mg; A), S44819 (50 mg; C), and placebo (E) or after drug intake comparing S44819 (100 mg; red) versus placebo (blue; B) and S44819 (50 mg; red) versus placebo (blue; bottom; D). The 100 mg S44819 dose decreased specifically the N45 TEP component compared with the baseline measurement (A) and compared with postdrug placebo (B), whereas there were no changes in other drug conditions and/or TEP components. Horizontal black bars underneath the N45 denote the significant periods of drug-induced changes. Data are grand averages of those channels that showed a significant difference in the N45 TEP component in the 100 mg S44819 postdrug versus baseline (A) or between the postdrug 100 mg S44819 and placebo conditions (B). These channels are indicated in Figure 6, A and B, respectively.