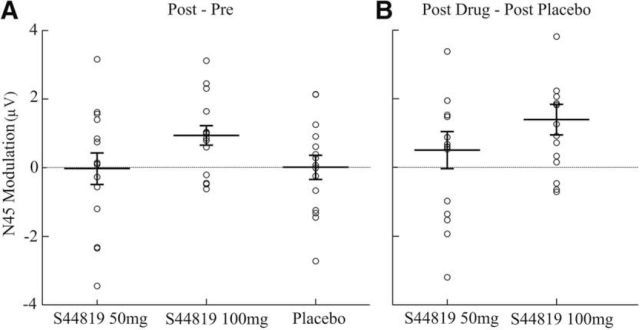
Figure 7.
Drug-induced modulation of the N45 TEP component (single-subject data). Scatter plots of individual amplitude modulations (A: postdrug − baseline; B: postdrug − postplacebo) of the N45 for all conditions are illustrated. In all conditions, data were extracted from EEG channels showing a significant difference for postdrug 100 mg S44819 − baseline S44819 (100 mg; A), or postdrug 100 mg S44819 − postplacebo (B). Error bars indicate the group mean ±1 SEM.

