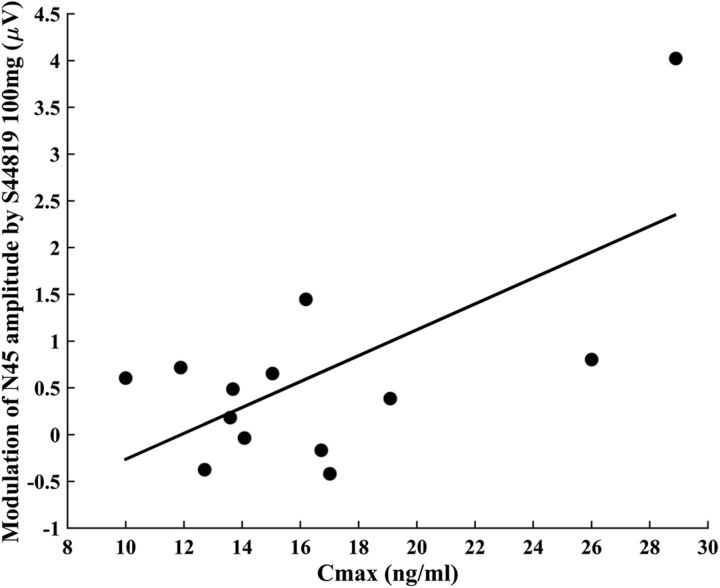
Figure 8.
Correlation between the peak 100 mg S44819 serum concentration and the change in N45 amplitude (postdrug 100 mg S44819 − baseline). Pearson correlation coefficient r = 0.66, p = 0.015. The data from only 13/15 subjects were subjected to this correlation analysis because two subjects had no identifiable N45 potential.

