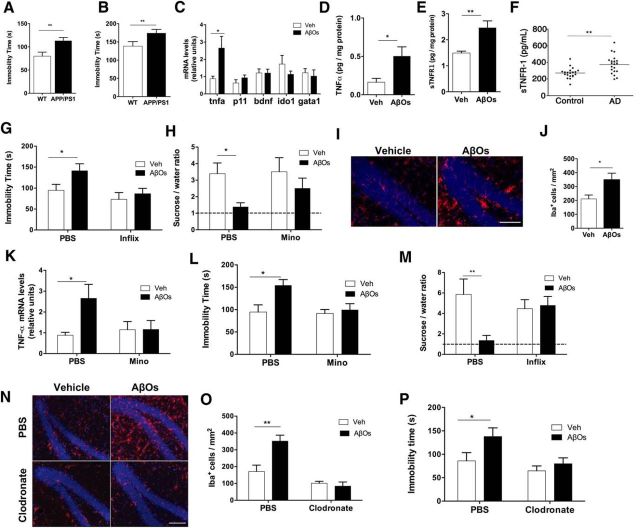
Figure 1.
Microglial activation and TNF-α signaling underlie AβO-induced depressive-like behavior in mice. A, B, WT or APP/PS1 mice (8–9 months old) were tested in the FST (A) or tail suspension test (B). n = 7–11 mice per group. C, Swiss mice (3 months old) received a single intracerebroventricular infusion of 10 pmol of AβOs (or vehicle). qRT-PCR was performed 24 h after AβO infusion. n = 8 mice per group. D, E, Brain TNF-α (D) and sTNFR1 (E) levels in hippocampal extracts from AβO-infused Swiss mice. n = 8–10 mice per group. F, Plasma levels of sTNFR1 in AD patients or age- and sex-matched controls. G, H, Mice were injected intracerebroventricularly with infliximab 30 min before AβO infusion. FST (G) or sucrose preference test (H) was performed 24 h after AβO infusion. n = 14–15 mice per group in the FST group; n = 6–7 per group in the sucrose preference test group. I, Representative immunohistochemistry images for Iba-1 (red) in hippocampal sections from AβO- or vehicle-injected Swiss mice. Nuclei are in blue (DAPI). n = 4 per group (20 images per animal). Scale bar, 50 μm. J, Quantification of Iba-1+ cells in the dentate gyrus of mice infused with AβOs or vehicle. K–M, Swiss mice received daily intraperitoneal injections of vehicle (saline) or minocycline (50 mg/kg/d) for 3 d before intracerebroventricular infusion of AβOs or vehicle. qRT-PCR for determination of TNF-α expression was performed 24 h after AβO injection (K). n = 6–8 per group. FST (L) or sucrose preference test (M) was performed 24 h after AβO infusion. n = 17–23 per group in the FST group; n = 6–7 in the sucrose preference test group. N–P, Clodronate- or PBS-containing liposomes were administered intracerebroventricularly to mice in a single dose 3 d before AβO or vehicle infusion. N, Brains were processed for immunohistochemistry 24 h after AβO injection. Hippocampal sections were labeled with anti-Iba-1 (red) and DAPI (blue). Scale bars, 50 μm. n = 3–5 mice per experimental group (20 hippocampal images per animal). O, Quantification of Iba-1+ cells in the dentate gyrus of mice infused with AβOs or vehicle that had been treated previously or not with clodronate. P, FST performed 24 h after AβO injection. n = 9–11 per group. In all panels, bars represent means ± SEM, *p ≤ 0.05, **p ≤ 0.01 (A, B, Welch's t test; C–E, J, Student's t test; F, Mann–Whitney U test; G, K, L, M, O, P, two-way ANOVA followed by Dunnett's multiple-comparisons test).

