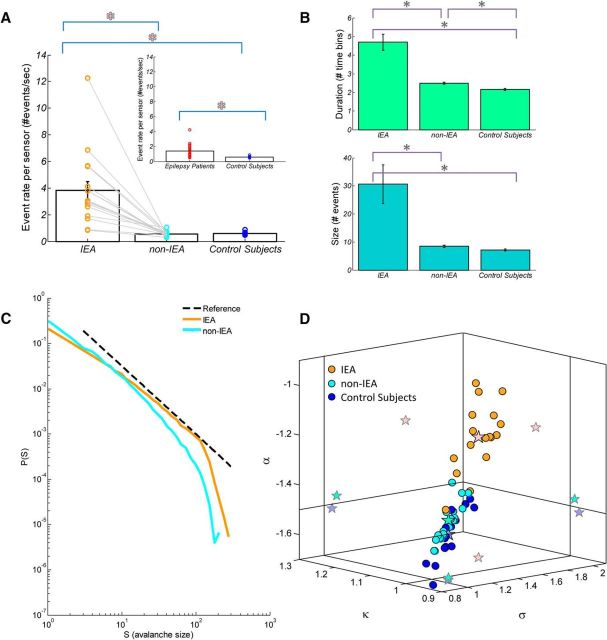
Figure 3.
Comparison of suprathreshold events and neuronal avalanche metrics between IEA and non-IEA periods from patients with epilepsy versus control subjects. A, Bar plot of mean suprathreshold event rate ± SEM of IEA versus non-IEA periods. Notably, for each epilepsy patient, the event rate during IEA was higher than that during non-IEA (indicated for each patient by an orange or a cyan circle, respectively, and linked by a gray line). Inset, Bar plot of mean event rate ± SEM of epilepsy patients versus healthy control subjects. Red asterisks indicate significance. B, Mean avalanche size (number of events) ± SEM and mean duration (number of time bins) ± SEM are represented in bar plots (turquoise and green bars, respectively). Gray asterisks indicate significance. Particularly, for each patient with epilepsy, the size and duration during IEA were greater than during non-IEA. C, Avalanche size distributions of IEA and non-IEA periods from an individual patient. Black dashed line indicates a reference power law (α = −1.5). During IEA periods, the avalanche size distribution for this patient had a substantially higher power law exponent (α = −1.22) than expected for a critical branching process, whereas during non-IEA periods the exponent was much closer to expected value (α = −1.45). D, Three-dimensional phase plot of the power law exponent, α, the nonparametric measure, κ, and the branching parameter, σ, for both IEA and non-IEA periods from epilepsy patients and for healthy control subjects. Each orange and cyan point indicates a single epilepsy patient at IEA and non-IEA, respectively. Blue point indicates a healthy control subject. Stars indicate mean across-subjects and two-dimensional projections of the mean. Solid vertical and horizontal lines indicate the theoretical expected value for a critical branching process (α = −1.5, κ = 1.0, σ = 1.0). Whereas the mean values of the parameters obtained from patients during non-IEA periods and from control subjects were similar to the theoretical values, the mean values of the parameters obtained from patients during IEA periods differed substantially from the theoretical values.

