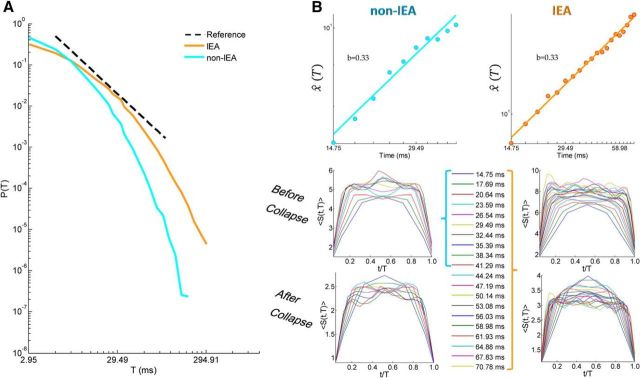
Figure 4.
Temporal organization of avalanches across all patients: a “grand” perspective. A, Cascade duration distribution of IEA and non-IEA periods from all accumulated avalanches from all patients. Black dashed line indicates a reference power law (β = −2.0). During IEA periods, the avalanche duration distribution had a substantially higher power law exponent (β = −1.56) than expected for a critical branching process, whereas during non-IEA periods the exponent was much closer to the theoretically expected value (β = −1.92). B, Avalanche shape collapse analysis. Top panels, The estimated scaling function χ̂(T) as a function of T. The extracted power law exponent b is equal to 0.33 for both IEA (right) and non-IEA (left) periods. Bottom panels, Mean avalanche shape for each duration, before and after collapse, for both IEA (right) and non-IEA (left). The durations represented in the shape analysis of IEA periods are marked by an orange bracket to the right of the legend, and the ones of non-IEA periods, by a cyan bracket to the left of the legend. The scales of the panels for IEA (right) and non-IEA (left) periods are not the same.

