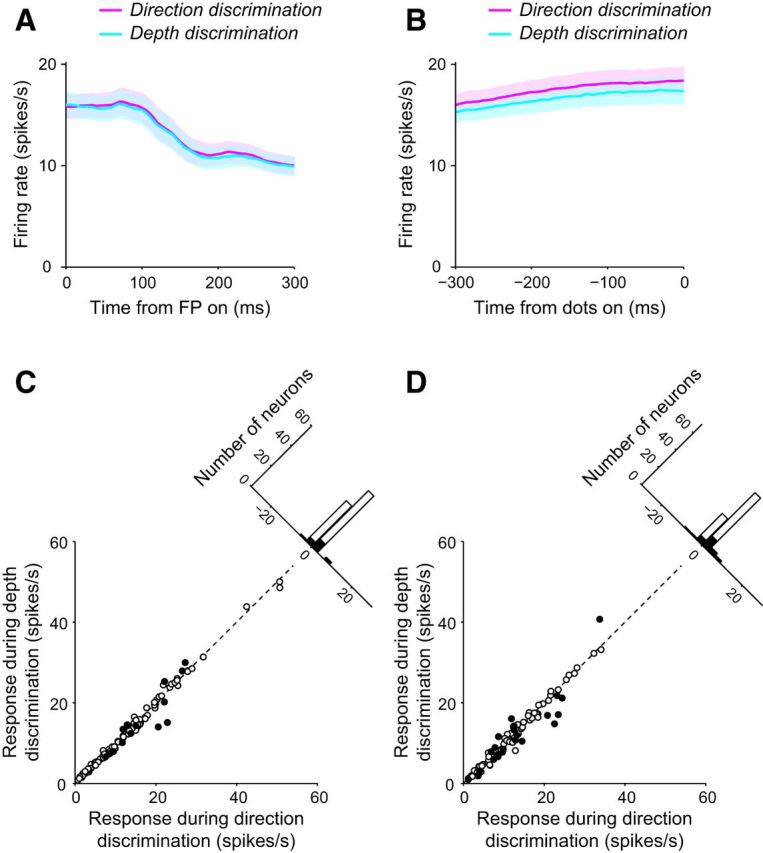
Figure 7.

Response of LIP neurons before stimulus presentation. The average response of all LIP neurons during the direction (magenta) and depth (cyan) discrimination tasks are plotted from the time of fixation point (FP) onset (A) and until the time of random dot presentation (B). C, For all LIP neurons, the response after the FP onset during depth discrimination plotted against response during direction discrimination. The filled circles denote neurons that had differential responses during the direction and depth discrimination tasks. D, For all LIP neurons, the response until the time of random dot presentation during depth discrimination plotted against the response during direction discrimination. The filled circles denote neurons that had differential responses during the direction and depth discrimination tasks.
