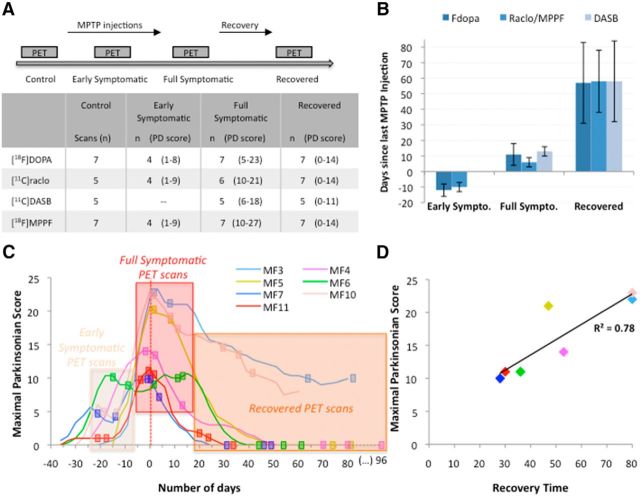
Figure 1.
Study design and schedule of PET scan acquisitions. A, Timeline of the experimental design with the number (n) of animals in each state and for each radioligand. B, Mean time (days) ± SD between last MPTP injection and PET acquisition for each radioligand. C, Evolution of parkinsonian score during MPTP intoxication and recovery. Data represent the evolution of appearance and disappearance of motor symptoms during and after MPTP intoxication. Timelines are aligned such that day 0 corresponds to the day on which the maximal parkinsonian score was obtained from an individual animal. The rectangle represents PET scan acquisition. D, Positive correlation between maximal parkinsonian score and the time needed for each animal to recover spontaneously from their motor symptoms once MPTP injections were stopped (n = 7).

