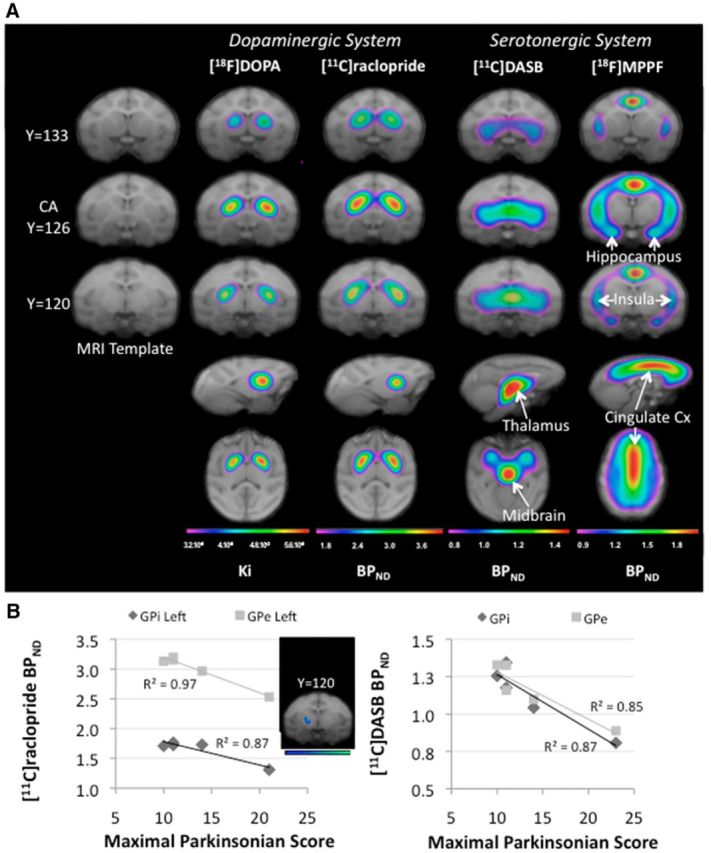
Figure 2.

PET imaging at baseline. A, Spatially normalized mean parametric images of each radiotracer collected at baseline superimposed on the brain Macaca fascicularis MRI template (Ballanger et al., 2013). The parametric images are shown in color, whereas the MRIs are shown in grayscale. Colors represent the level of binding expressed as uptake ratio using the cerebellum as a nonspecific reference for each radioligand (Ki for [18F]DOPA and BPND for [11C]raclopride, [11C]DASB, and [18F]MPPF). Red represents high Ki or BPND, whereas blue denotes low Ki or BPND. For each radiotracer, three coronal (first three rows), one sagittal (fourth row), and one transaxial (fifth row) slices are shown. B, Negative correlation reported within the pallidum internal (GPi) and external (GPe) parts between both the [11C]Raclopride and [11C]DASB BPND collected at baseline and the maximal parkinsonian score obtained in the full symptomatic state (n = 5).
