
Figure 3.
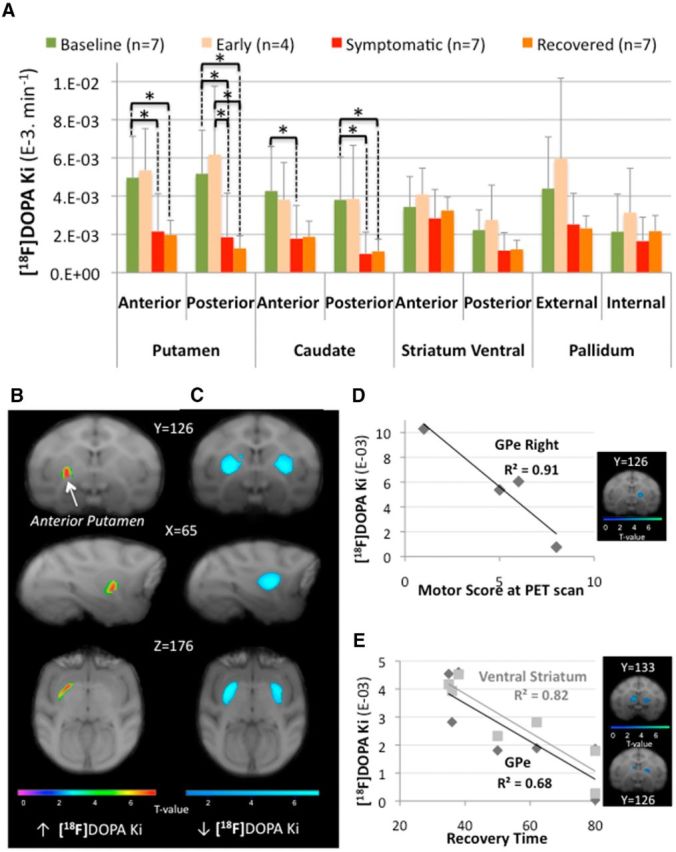
[18F]DOPA uptake modifications. A, ROI assessment of [18F]DOPA uptake (Ki) between the different states (n: number of animals in each state). Asterisks indicate significant differences (p < 0.05). The bar graphs show the mean ± SD. B, C, SPM showing changes in [18F]DOPA uptake (Ki) rendered over coronal (first row), sagittal (second row), and transaxial (third row) sections of the brain Macaca fascicularis MRI template from Ballanger et al. (2013). The statistical threshold of the voxel-based analyses was set at p < 0.001 uncorrected. Color bars represent the t value. Specifically, B displays the significant cluster of increase Ki observed within the left anterior putamen in the early symptomatic state compared with baseline and C displays significant clusters (involving the bilateral putamen) of decreased Ki observed in the recovered state compared with baseline. D, E, Correlation analyses between [18F]DOPA uptake (Ki) and motor score or recovery time during the different states. In particular, motor scores were negatively correlated with Ki values within the external pallidum (GPe) collected in the early symptomatic state (D, n = 4) and recovery time was negatively correlated with Ki values within the GPe and the ventral striatum collected during the full symptomatic state (E, n = 7). For illustration, results from voxelwise regression with SPM are shown at a more liberal threshold (uncorrected p < 0.05, D, and p < 0.01, E). Color bars represent the t value.