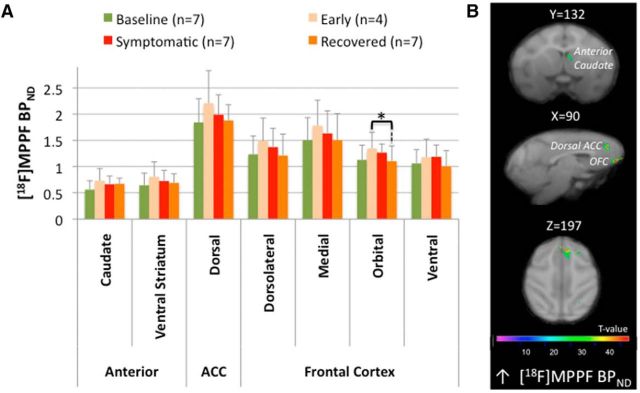
Figure 5.
[18F]MPPF binding potential modifications. A, ROI assessment of [18F]MPPF binding potential (BPND) between the different states (n: number of animals in each state). The bar graphs show the mean ± SD. B, SPM showing changes in [18F]MPPF BPND rendered over coronal (first row), sagittal (second row), and transaxial (third row) sections of the brain Macaca fascicularis MRI template from Ballanger et al. (2013). The statistical threshold of the voxel-based analysis was set at p < 0.001 uncorrected. Color bars represent the t value. B, Significant clusters of increased [18F]MPPF BPND observed in the early symptomatic state compared with baseline within the anterior caudate and at the cortical level within the orbitofrontal cortex and the dorsal ACC.

