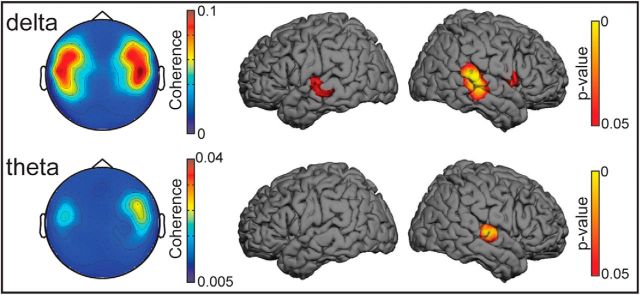
Figure 3.
Sensor and source space results obtained in the No noise condition. Left, Spatial distribution of group-level sensor space coherence in the δ band (0.5 Hz; top) and θ band (4–8 Hz; bottom). In both frequency bands, the coherence maxima are located bilaterally at gradiometer sensors covering the temporal areas. The sensor array is viewed from the top. Right, Results obtained in the source space. Group-level statistical (p value) maps showing brain areas displaying statistical significant coherence. Maps are thresholded at p < 0.05. In the δ band, significant local maxima occur at the lower bank of the superior temporal gyrus bilaterally, with no significant hemispheric lateralization. In the θ band, a significant local maximum is seen only at right supratemporal auditory cortex.

