
Figure 7.
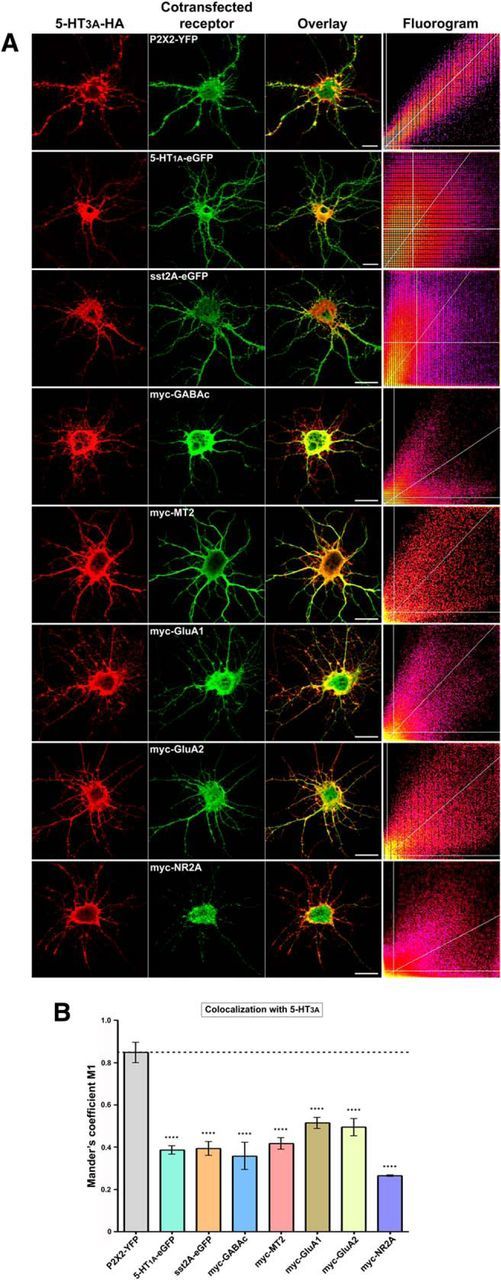
Specificity of the 5-HT3A and P2X2 receptor interaction. Hippocampal neurons were cotransfected at 7 DIV with 5-HT3A-HA and P2X2-YFP, 5-HT1A-eGFP, sst2A-eGFP, myc-GABAc (ρ1), myc-MT2, myc-GluA1, myc-GluA2, or myc-NR2A subunits. A, Immunofluorescence detection was performed after 48 h (red represents anti-HA; green represents anti-eGFP or anti-myc). Scale bars, 20 μm. ROI were chosen within the dendritic trees to select cluster-rich areas and avoid the center of large neurites, and colocalization was monitored with the JACoP plugin of ImageJ (manual thresholding). Corresponding fluorograms for each cotransfected couple of receptors are represented on the right panels. B, Bars represent mean ± SEM values of Mander's M1 coefficients (percentage of 5-HT3AR-HA fluorescence overlapping with cotransfected receptor's fluorescence). Significant differences appeared only between interacting (P2X2) and noninteracting subunits (one-way ANOVA with Dunnett's Multiple Comparison post hoc test); n = 4–8. ****p < 0.0001.