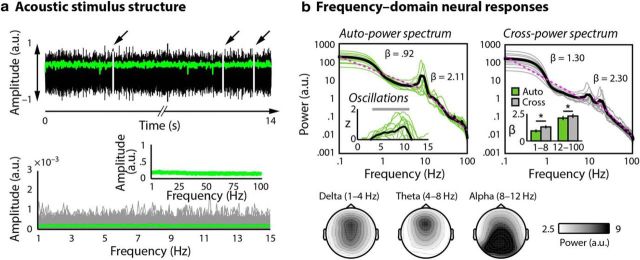
Figure 1.
a, Acoustic stimulus structure. Top, Stimuli were narrow-band noises without low-frequency rhythmic structure. Hilbert envelope is overlaid in green. Two, three, or four gaps (marked by arrows) were embedded in each 14 s stimulus. Bottom, Frequency-domain representation of acoustic stimuli for a single representative participant; amplitude spectra for individual stimuli are shown in gray, and the average over stimuli is overlaid in green. Inset, Average amplitude spectrum up to 100 Hz. b, Frequency-domain neural responses. Top, Autopower (left, both oscillatory and 1/fβ contributions) and cross-power (right, 1/fβ contributions only) spectral densities calculated for coarse-graining spectral analysis, plotted in log–log coordinates for single participants (green, gray) with the mean overlaid (black, thick line). Fits from which power-law exponents, β, were estimated for low (0.1–8 Hz) and high (12–100 Hz) frequencies are overlaid in pink. Subtracting cross-power spectral density from autopower spectral density yields an estimate of the oscillatory contributions to power (inset, left). Oscillatory power was significantly nonzero at all frequency bins between 3.4 and 10.75 Hz (marked by gray bar). Power-law exponents, β, differed significantly between auto- and cross-power spectral densities for both low (p < 0.001) and high (p = 0.003) frequencies (inset, right). Topographies are shown below for the classically defined delta (1–4 Hz), theta (4–8 Hz), and alpha (8–12 Hz) frequency bands in the autopower spectral density function.

