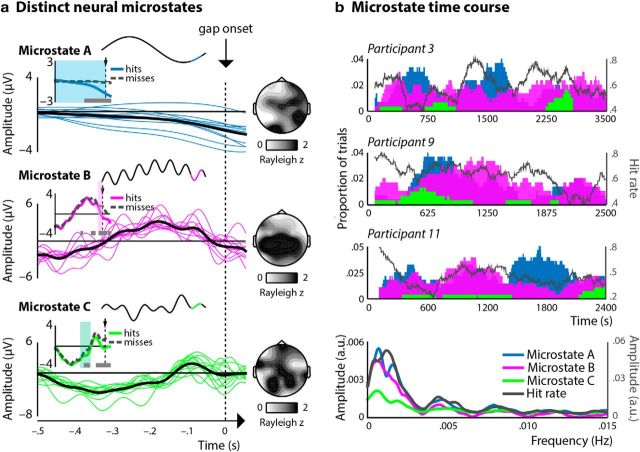
Figure 5.
Gap-detection performance was determined by distinct delta–governed neural microstates. a, When hit rates were determined by delta phase alone (Microstate A), by a combination of delta and high-alpha phase (Microstate B), and by a combination of delta, theta, and low-alpha phase, gap-detection hit rates were relatively high when the local near trough-to-rising phase (highlighted in blue, pink, and green, respectively) of the complex neural activity coincided with gap onset (insets). Single-participant (thin, colored lines) and mean (thick, black lines) time course data corresponded well to the schematic microstates. Insets compare time courses preceding detected (hits, blue, pink, green) and undetected (misses, gray dashed lines) gaps. The time courses differed significantly (marked by gray bars below time courses) in time ranges corresponding to our analysis based on circular–linear correlations (Fig. 2, marked by colored shaded bars), and polarity was more negative preceding hits than misses. Topographies show the strength of consistency across participants in terms of optimal neural phase for gap-detection performance. b, Time courses of microstate prevalence (shown here for three representative participants) revealed slow fluctuations in the prevalence of individual microstates as well as gap-detection performance that had an average rate of 0.003 Hz across participants (bottom).

