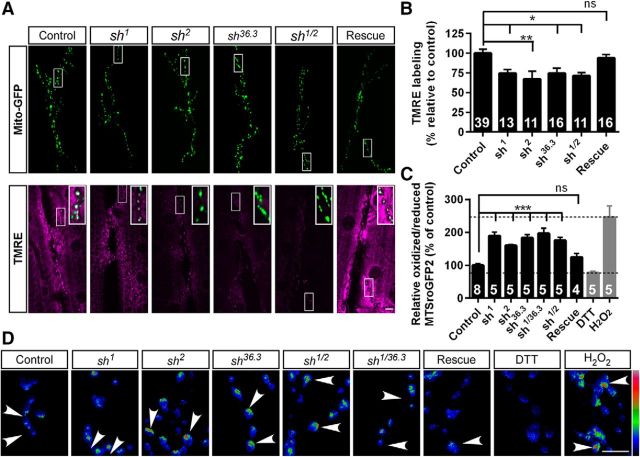
Figure 5.
Mitochondrial function is disrupted in shawn mutants. A, shawn mutants, labeled with 50 nm TMRE for 15 min, display a more positive mitochondrial membrane potential. Scale bar, 10 μm. Insets in the TMRE channel represent merges of mito-GFP (green) and TMRE (magenta). B, TMRE labeling at presynaptic terminals was quantified using the D42–Gal4>mito–GFP signal as a mask. Although TMRE labeling in the muscles is clearly decreased, we focused here on the quantification of neuronal mitochondria. The number of animals analyzed is indicated in the bar graphs. On average, two NMJs per animal were analyzed. ns, Not significant; *p < 0.05; **p < 0.01; F(5,100) = 5.296, ANOVA (p = 0.0002). C, Mitochondrial redox status in shawn mutants is increased. Ratio quantification of the oxidized/reduced MTSroGFP2 signal for control, mutant, rescue, DTT (gray), and H2O2 (gray) samples. The number of animals analyzed is indicated in the bar graphs. On average, four NMJs per animal were analyzed. ns, Not significant; ***p < 0.001, F(6,30) = 16.25, ANOVA (p < 0.0001). Dotted lines represent the working range as defined by H2O2 (upper limit) and DTT (lower limit) treatment. D, Overview of ratiometric images of MTSroGFP2 at larval NMJs. Color bar of the ratio: blue indicates low oxidized/reduced ratio, red indicates high oxidized/reduced ratio; arrowheads highlight the increased oxidized/reduced ratio in shawn mutants. Scale bar, 5 μm.

