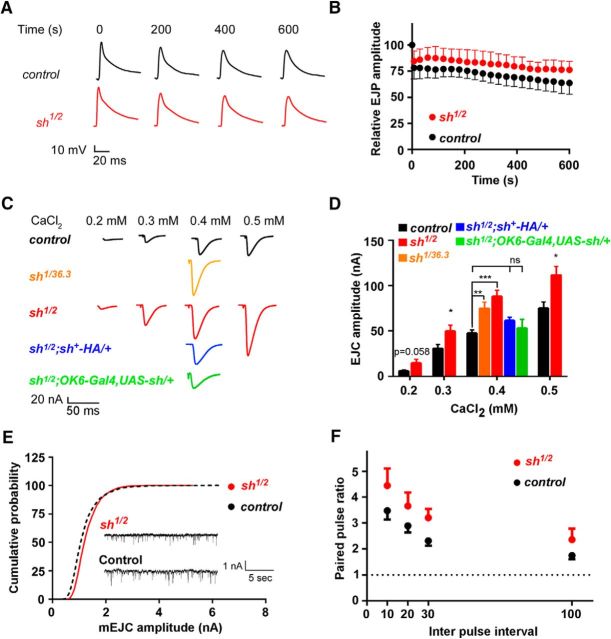
Figure 6.
The Ca2+-mediated evoked response pathway is altered in shawn mutants. A, Representative raw traces for the EJP recordings (10 Hz stimulation for 10 min) at different timepoints (s) in control (FRT19A, black) and mutant (sh1/2, red) third-instar larvae. B, Quantification of EJP amplitudes. EJP amplitudes were binned every 30 s and normalized to the prestimulus amplitude. C, Representative raw data traces of the EJC recordings for control (FRT19AISO, black), mutant (sh1/36.3, orange; sh1/2, red), and rescue (sh1/2;sh+–HA/+, blue; sh1/2;OK6–Gal4,UAS-sh/+, green) animals in different extracellular concentrations of Ca2+. D, Quantification of the EJC amplitudes in the presence of different Ca2+ concentrations. At least seven larvae per genotype were analyzed. ns, Not significant; *p < 0.05; **p < 0.01; ***p < 0.001; F(4,43) = 7.985, ANOVA (p < 0.0001). E, Representative traces for mEJC recordings and quantification of the cumulative amplitude probability. Nine larvae were analyzed per genotype. F, Quantification of paired-pulse ratio at the NMJ for the different interpulse intervals tested for control (FRT19AISO: 10 ms, n = 10; 20 ms, n = 8; 30 ms, n = 9; 100 ms, n = 10) and mutant (sh1/2: 10 ms, n = 7; 20 ms, n = 8; 30 ms, n = 8; 100 ms, n = 8) animals.

