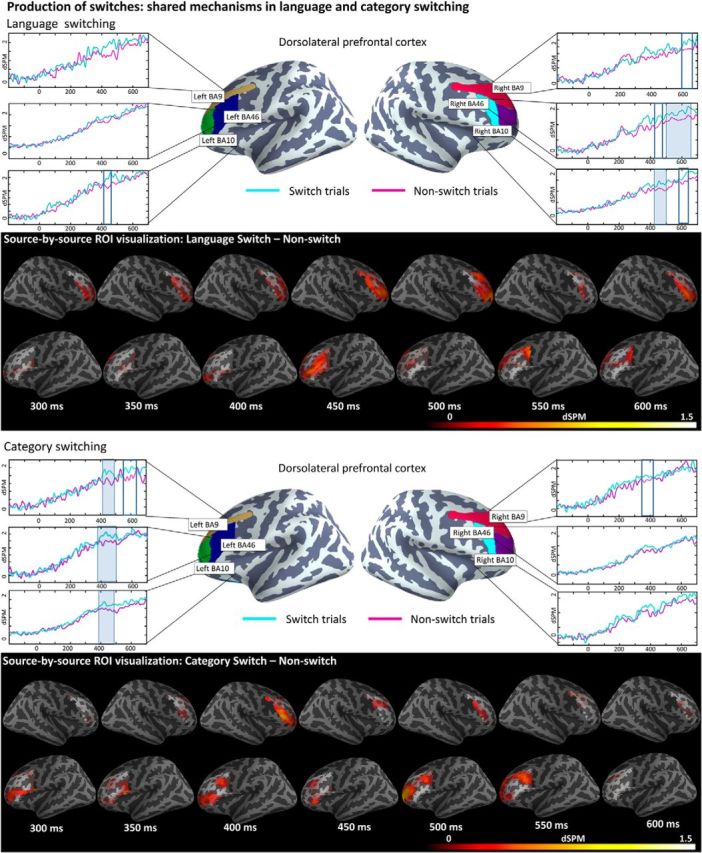
Figure 3.

ROI results for pairwise comparisons for production conditions in the dlPFC; activation averaged across subjects. A freeSurfer average brain illustrates the spatial distribution of the BAs included in the analyses color coded by BA. On the waveform plots, the shaded regions indicate that the difference in activity between the two tested conditions was significant at p = 0.05 (corrected), whereas the boxed region indicates marginally significant effects at p < 0.01 (corrected). Significance was determined using a nonparametric permutation test (Maris and Oostenveld, 2007) performed from 300–500 and 500–700 milliseconds (10,000 permutations). The whole-brain comparisons display all pairwise effects source by source within our ROIs. Only effects in which the first condition (switch condition) elicited greater activity than the second condition (non-switch activity) for at least 15 ms in at least 15 adjacent cortical sources at p < 0.05 are displayed, providing a complementary visualization of the spatial extent of our effects within the ROIs. Section A illustrates differences during the language-switching task and section B illustrates comparisons conducted within the category-switching task.
