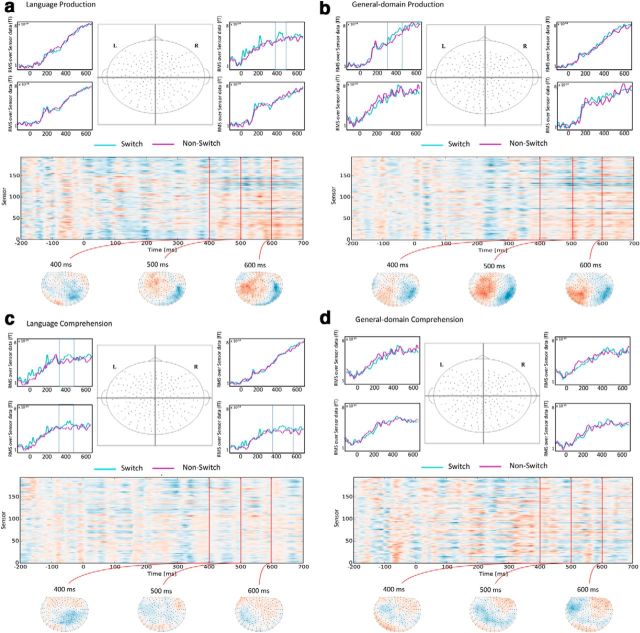
Figure 5.
Pairwise comparisons of sensor data between switch and non-switch trials in all experimental tasks: (a) language production, (b) domain-general production, (c) language comprehension, and (d) domain-general comprehension. In each panel, the top part includes the activity waveforms for switch and non-switch conditions in each of the four partitions of the sensor array (front left, front right, back left, back right). A topography located in the middle of the four waveform plots shows the boundaries of the sensor array partitions. No pairwise comparison resulted in statistically reliable differences; however, clusters containing activity increases for switch conditions are displayed in a boxed region. The lower part of each panel includes a sensor/time distribution of t-values for the switch versus non-switch pairwise comparisons. Below this plot, the topographic distribution of such values is displayed: Red indicates increases for switch conditions and blue indicates increases for non-switch conditions.

