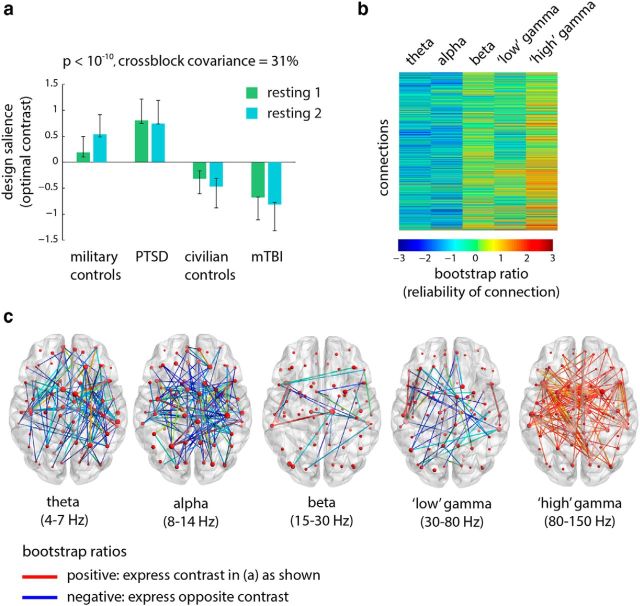
Figure 2.
Functional connectivity: group differences. The dominant PLS latent variable, capturing the effect of group membership on resting-state functional connectivity (measured by the wPLI) in multiple frequency bands. a, The optimal combination of groups and conditions (contrast). Error bars represent bootstrap-estimated 95% confidence intervals. b, Bootstrap ratios: a linear combination of connections (i.e., a network), weighted by how reliably they contribute to the latent variable. For a given connection, a high-magnitude positive bootstrap ratio indicates that the connection reliably expresses the contrast in a. A high-magnitude negative bootstrap ratio indicates that the connection expresses the opposite contrast. c, Statistical maps showing networks of connections that reliably express the contrast in a, as determined by bootstrapping (see Materials and Methods).

