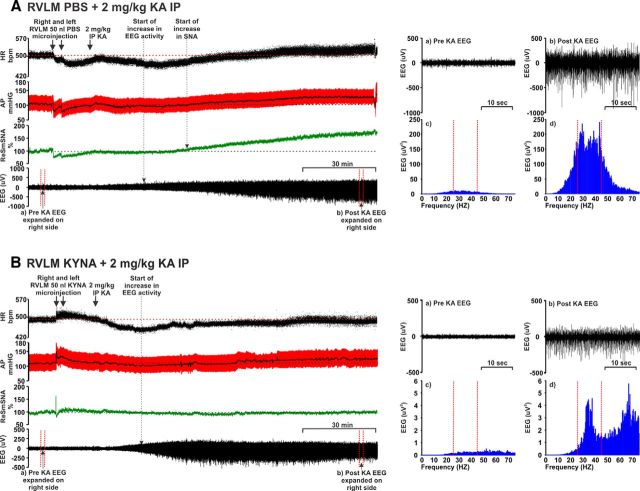
Figure 1.
Effect of bilateral RVLM microinjection of (A) PBS (50 nl) and (B) KYNA (50 nl; 100 mM) followed by 2 mg/kg intraperitoneal KA in an anesthetized rat (see Materials and Methods) showing the effect on the following: from the top, (i) HR (bpm), (ii) AP (arterial pressure; mmHg), (iii) SNA (%), and (iv) EEG (μV). Arrow indicates time of RVLM microinjections and intraperitoneal KA. Dotted arrows indicate the starting points for increase in EEG and/or SNA activity. Right side panels, Pre (a) and post (b) KA EEG represents the expanded waveform from respective period. Baseline (a), which is a pre-KA period with desynchronous waves, and (b) post-KA period with increased γ range frequencies and followed by the data from the same EEG, drawn as a power spectrum (c, d, respectively) (during post-KA period γ range frequencies, which is shown between two dotted lines) are increased. Increase in gamma range frequency (25–45 Hz) is characteristic property of KA-induced seizures (Olsson et al., 2006; Gurbanova et al., 2008).

