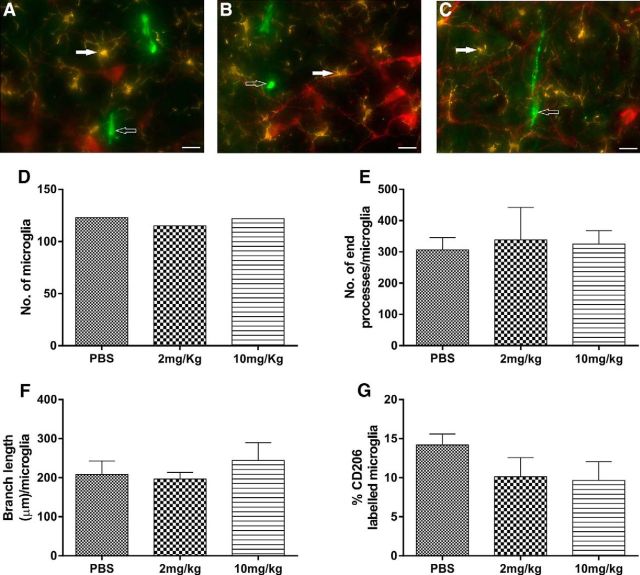
Figure 5.
Fluorescence images of RVLM area containing TH+-ir (red), Iba1-labeled microglia (yellow), and CD206-labeled M2 microglial cells (green) and their morphological analysis in different treatment groups of rats. Scale bar, 20 μm. TH, Iba1 and CD206 immunoreactivity in RVLM in PBS (A), 2 mg/kg KA (B), and 10 mg/kg KA (C) treated rats. In all of these three groups, TH+-ir neurons (red) were surrounded with microglia with its round cell body and normal appearing processes with few ramifications (closed arrow) and no change in number of anti-inflammatory M2 microglia (open arrow). Quantitative analysis of number of microglial cells in mean square area (D), number of end processes/microglia (E), branch length (μm)/microglia of Iba1-labeled microglial cells (F), and percentage of CD206-labeled M2 microglial cells (G) in the RVLM of vehicle-treated and KA-induced seizure (2 and 10 mg/kg i.p.) rats.

