Abstract
Parkinson's disease (PD) is a prevalent degenerative disorder affecting the CNS that is primarily characterized by resting tremor and movement deficits. Group I metabotropic glutamate receptor subtypes 1 and 5 (mGluR1 and mGluR5, respectively) are important targets for investigation in several CNS disorders. In the present study, we investigated the in vivo roles of mGluR1 and mGluR5 in chronic PD pathology by performing longitudinal positron emission tomography (PET) imaging in A53T transgenic (A53T-Tg) rats expressing an abnormal human α-synuclein (ASN) gene. A53T-Tg rats showed a dramatic decline in general motor activities with age, along with abnormal ASN aggregation and striatal neuron degeneration. In longitudinal PET imaging, striatal nondisplaceable binding potential (BPND) values for [11C]ITDM (N-[4-[6-(isopropylamino) pyrimidin-4-yl]-1,3-thiazol-2-yl]-N-methyl-4-[11C]methylbenzamide), a selective PET ligand for mGluR1, temporarily increased before PD symptom onset and dramatically decreased afterward with age. However, striatal BPND values for (E)-[11C]ABP688 [3-(6-methylpyridin-2-ylethynyl)-cyclohex-2-enone-(E)-O-[11C]methyloxime], a specific PET ligand for mGluR5, remained constant during experimental terms. The dynamic changes in striatal mGluR1 BPND values also showed a high correlation in pathological decreases in general motor activities. Furthermore, declines in mGluR1 BPND values were correlated with decreases in BPND values for [18F]FE-PE2I [(E)-N-(3-iodoprop-2E-enyl)-2β-carbo-[18F]fluoroethoxy-3β-(4-methylphenyl) nortropane], a specific PET ligand for the dopamine transporter, a biomarker for dopaminergic neurons. In conclusion, our results have demonstrated for the first time that dynamic changes occur in mGluR1, but not mGluR5, that accompany pathological progression in a PD animal model.
SIGNIFICANCE STATEMENT Synaptic signaling by glutamate, the principal excitatory neurotransmitter in the brain, is modulated by group I metabotropic glutamate receptors, including the mGluR1 and mGluR5 subtypes. In the brain, mGluR1 and mGluR5 have distinct functional roles and regional distributions. Their roles in brain pathology, however, are not well characterized. Using longitudinal PET imaging in a chronic rat model of PD, we demonstrated that expression of mGluR1, but not mGluR5, dynamically changed in the striatum accompanying pathological PD progression. These findings imply that monitoring mGluR1 in vivo may provide beneficial information to further understand central nervous system disorders.
Keywords: nondisplaceable binding potential, dopamine transporter, mGluR1, mGluR5, Parkinson's disease, PET
Introduction
Parkinson's disease (PD) is the second most common chronic neurodegenerative disorder, following Alzheimer disease (AD), and is characterized by akinesia, tremor, rigidity, and poor balance. PD is believed to be caused by a combination of environmental and genetic factors leading to structural changes in the protein α-synuclein (ASN). In neurons, alterations in ASN structure can lead to protein aggregation, forming soluble oligomers and insoluble filaments known as Lewy bodies, which are a hallmark of PD pathology. Aggregation of abnormal ASN can affect many factors in neurodegenerative disorders, such as oxidative stress, neuroinflammation, and synaptic transmissions (Roberts and Brown, 2015).
Glutamate is the primary neurotransmitter involved in excitatory neurotransmission. Among the glutamate receptor family, metabotropic glutamate receptors are G-protein-coupled receptors comprising eight subtypes (mGluR1–mGluR8). These subtypes are divided into three groups (groups I–III), based on differences in the G-protein α subunit and subsequent transduction pathways (Nakanishi et al., 1998). The receptor subtypes mGluR1 and mGluR5 are members of group I, and activate the Gq-protein. This process initiates the phosphatidylinositol-signaling pathway, which leads to intracellular calcium release and protein kinase C activation (Aramori and Nakanishi, 1992; Francesconi and Duvoisin, 1998; Ferraguti et al., 2008). Thus, mGluR1 and mGluR5 can trigger phosphorylation-signaling cascades and modulate gated ion channel activity via intracellular calcium release. Although mGluR1 and mGluR5 exhibit a high degree of homology, each has a distinct regional distribution and expression pattern in the brain (Abe et al., 1992; Fotuhi et al., 1993). At present, the respective roles of mGluR1 and mGluR5 in CNS disorders are not well characterized.
A number of reports have demonstrated that mGluR1 and mGluR5 modulators provided neuroprotection in CNS disorders such as stroke (Bao et al., 2001; Kohara et al., 2008), Huntington's disease (Schiefer et al., 2004), AD (Ulus and Wurtman, 1997), epilepsy (Löscher et al., 2006; Tang et al., 2007), and PD (Dekundy et al., 2006; Vernon et al., 2008; De Leonibus et al., 2009; Rylander et al., 2010). Moreover, in acute PD models using 6-hydroxy dopamine (6-OHDA) and 1-methyl-4-phenyl-1,2,3,6-tetrahydropyridine, mGluR1 or mGluR5 antagonist administration protected against dopaminergic neuronal loss in the substantia nigra (Aguirre et al., 2001; Vernon et al., 2007). Additionally, in a 6-OHDA-treated nonhuman primate acute PD model, mGluR5 expression was elevated in the striatum, whereas mGluR1 expression was decreased in the globus pallidus and substantia nigra (Kaneda et al., 2005; Samadi et al., 2008; Sanchez-Pernaute et al., 2008). These findings suggest that alterations in group I mGluR expression are associated with the onset of PD. Thus, group I mGluRs may be potentially useful biomarkers to characterize PD-related brain pathology.
Positron emission tomography (PET) is frequently used to monitor in vivo brain activity, and allows for noninvasive assessment of longitudinal changes in target molecules. In this study, we monitored longitudinal changes in striatal group I mGluR expression among chronic PD model rats with abnormal ASN aggregation using selective radioligands and PET imaging.
Materials and Methods
Animals.
Female Sprague Dawley transgenic rats expressing human mutant A53T ASN (A53T-Tg; n = 12) and noncarrier rats (n = 6) were purchased from Taconic Biosciences. Animals were kept in a temperature-controlled environment with a 12 h light/dark cycle and were given a standard diet (Funabashi Farm). All animal experiments were performed according to the recommendations specified by the Committee for the Care and Use of Laboratory Animals of the National Institute of Radiological Sciences.
Production of radioligands.
Three PET ligands (Fig. 1) were synthesized in our laboratory and used to monitor group I metabotropic glutamate receptors (mGluR1 and mGluR5) and dopaminergic neurons. Imaging of mGluR1 was performed using the mGluR1-selective PET ligand N-[4-[6-(isopropylamino) pyrimidin-4-yl]-1,3-thiazol-2-yl]-N-methyl-4-[11C]methylbenzamide ([11C]ITDM; Fujinaga et al., 2012). At the end of synthesis (EOS), [11C]ITDM had >99% radiochemical purity and 56–144 GBq/μmol specific activity (SA).
Figure 1.
Chemical structures of PET ligands used in this study.
For mGluR5 imaging, we used the mGluR5-selective PET ligand 3-(6-methylpyridin-2-ylethynyl)-cyclohex-2-enone-(E)-O-[11C]methyloxime [(E)-[11C]ABP688; Kawamura et al., 2014], yielding >99% radiochemical purity and 91–304 GBq/μmol SA at EOS.
To visualize dopaminergic neurons, the dopamine transporter (DAT)-selective PET ligand (E)-N-(3-iodoprop-2E-enyl)-2β-carbo-[18F]fluoroethoxy-3β-(4-methylphenyl) nortropane ([18F]FE-PE2I) was used (Schou et al., 2009). At EOS, [18F]FE-PE2I had >99% radiochemical purity and 28–279 GBq/μmol SA.
Open-field test.
The open field area (60 cm height by 60 cm width by 45 cm depth) was made from acrylic sheets and was divided into 16 equal-area squares. The open-field test (OFT) was used to evaluate exploratory activity in the rats. Each rat was placed in the center of the arena and was scored according to the numbers of squares the four paws crossed (locomotion). Rats were also scored for rearing, which was defined as the number of times that each rat had both front paws off the floor for a 5 min period, after 1 min of habituation. Before introducing each animal, any odors left in the arena by previous animals were eliminated using 70% ethanol.
Immunohistochemistry.
Noncarrier and A53T-Tg rats (aged 16 months; n = 3 per group) were anesthetized using 1.5% (v/v) isoflurane and killed by cervical dislocation. Their brains were quickly removed and frozen. Brain sections (10 μm thick) were prepared from frozen rat brains using a cryostat (HM560; Carl Zeiss) and mounted on slide glass (Matsunami). The slides were dried and then fixed in 4% paraformaldehyde for 15 min at room temperature. After washing with PBS, the slides were dipped in saline containing 1% H2O2 for 10 min. The slides were then immunostained with mouse polyclonal antibodies against human ASN proteins (Santa Cruz Biotechnology) and rabbit polyclonal antibodies against tyrosine hydroxylase (TH; Santa Cruz Biotechnology) using avidin–biotin complex immunostaining kits (ImmunoCruz; Santa Cruz Biotechnology) and examined using an all-in-one microscope and digital camera (Olympus).
PET procedure.
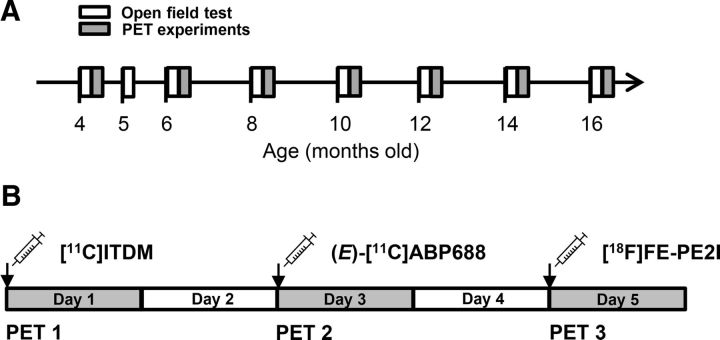
After conducting the OFT, four to six rats in each group were selected for PET experiments based on general motor activity scores. Similar rats based on scoring criteria were used in the scheduled PET experiments (as shown in Fig. 2).
Figure 2.
Experimental schedule for open-field testing and PET scans. A, Experimental time points in noncarrier and A53T-Tg rats. B, PET scan schedule for a given rat over the course of a week.
Each rat was anesthetized using 1.5% (v/v) isoflurane, and a 24-gauge intravenous catheter (Terumo Medical) was inserted into the tail vein. Rats were subsequently maintained under anesthesia and secured in a custom-designed chamber placed in the center of a small-animal PET scanner (Inveon; Siemens).
After target position adjustment for brain scanning, the dynamic emission scans (in three-dimensional list mode) were performed as follows: for [11C]ITDM, emission scans were performed for 90 min (12 frames for 10 s each, 3 frames for 20 s each, 3 frames for 30 s each, 3 frames for 1 min each, 3 frames for 2.5 min each, and 15 frames for 5 min each); for (E)-[11C]ABP688 and [18F]FE-PE2I, emission scans were each acquired for 60 min (12 frames for 10 s each, 3 frames for 20 s each, 3 frames for 30 s each, 3 frames for 1 min each, 3 frames for 2.5 min each, and 9 frames for 5 min each). After a transmission scan for attenuation correction using a 57Co source for 803s, [11C]ITDM (48–67 MBq, 0.2–0.9 nmol), (E)-[11C]ABP688 (40–54 MBq, 0.1–0.6 nmol), or [18F]FE-PE2I (11–16 MBq, 0.1–1.2 nmol) was injected via tail vein catheter. Rat body temperatures were maintained at 37°C using a heated (40°C) water circulation system (T/Pump TP401; Gaymar Industries) during the PET scan. After PET experiments, rats were allowed to recover from anesthesia and were taken back to the animal breeding facility.
Data analysis.
Acquired PET dynamic images with a 0.6 mm slice thickness were reconstructed by filtered-back projection using a Hanning's filter, with a Nyquist cutoff of 0.5 cycles per pixel. Images were then summed using analysis software (ASIPro VM; Siemens). For kinetic analysis, the time-activity curve (TAC) for each radioligand was acquired from the volumes of interest, which were manually mapped onto the striatum and cerebellum (for each radioligand), as well as the hippocampus, cingulate cortex, thalamus, and pons (for [11C]ITDM) using the rat brain magnetic resonance imaging (MRI) template described previously (Yui et al., 2011). The radioactivity was decay corrected to the injection time and is expressed as the standardized uptake value (SUV), which was normalized to the injected radioactivity and body weight. The SUV was calculated according to the following formula: SUV = (radioactivity per milliliter tissue/injected radioactivity) × gram body weight. To obtain the nondisplaceable binding potential (BPND) for each radioligand, kinetic analyses were performed using reference tissue models by the PMOD software (version 3.4; PMOD Technology). For [11C]ITDM, the Logan reference method was chosen for the analysis model, with a t* = 15 min (Logan et al., 1996), using TACs obtained from the pons as a reference region (Yamasaki et al., 2014). Briefly, selection of t* was based on visual inspection of the residual plots. A predetermined average of k2′ was acquired from the simplified reference tissue model (SRTM; Lammertsma and Hume, 1996). For (E)-[11C]ABP688 and [18F]FE-PE2I, kinetic analyses were performed according to the SRTM using TACs obtained from the cerebellum as a reference tissue (Elmenhorst et al., 2010; Sasaki et al., 2012). Respective parametric images were scaled according to the BPND and reconstructed using PMOD software and the TACs acquired from reference regions.
In vitro autoradiography.
The frozen brains (aged 16 months; n = 3 per group) were cut into 20-μm-thick sections using a cryostat (HM560; Carl Zeiss), and the slices were mounted on to glass slides (Matsunami Glass). The brain sections were preincubated for 20 min in 50 mm Tris-HCl buffer, pH 7.4, containing 1.2 mm MgCl2 and 2 mm CaCl2 at room temperature. The sections were then incubated for 30 min at room temperature in fresh buffer containing [11C]ITDM (18 MBq, 1.0 nm), (E)-[11C]ABP688 (6 MBq, 0.4 nm), or [18F]FE-PE2I (0.7 MBq, 16.5 pm). After incubation, the brain sections were washed (3 × 3 min) with cold buffer, dipped in cold distilled water, and dried in air. They were placed in contact with imaging plates (BAS-MS2025/Fujifilm). Autoradiograms were acquired using a Bio-Imaging Analyzer System (BAS5000/Fujifilm). Regions of interest (ROIs) in autoradiograms were manually drawn in the striatum. The degree of ligand binding (femtomoles per square millimeter) was calibrated using the MultiGauge analysis software, version 2.3 (Fujifilm).
Statistics.
All data are expressed as means ± SEs. Differences between the noncarrier and A53T-Tg groups were calculated using the Student's t test or two-way ANOVA with repeated measures. Post hoc analyses with Bonferroni method were applied. Statistical significance was determined at a 95% (p < 0.05) confidence level and is denoted with asterisks in the figures.
Correlation coefficients (r) for scatter plots were determined as follows: r > 0.7, a strong positive linear relationship; 0.7 > r > 0.4, a moderate positive relationship; 0.4 > r > 0.2, a weak positive linear relationship; r < 0.2, no linear relationship.
All statistic data were analyzed using GraphPad Prism 5 software.
Results
General motor activity in noncarrier and A53T-Tg rats
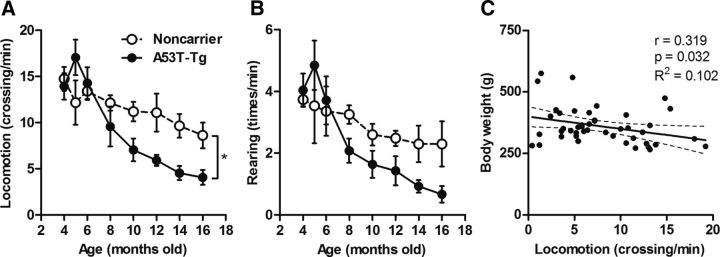
Age-associated changes in locomotion and rearing scores of noncarrier and A53T-Tg rats are shown in Figure 3. Locomotion and rearing scores tended to increase in 4- to 5-month-old A53T-Tg rats and then dramatically decreased at older ages. Although a weak correlation (r = 0.319) between weight gain and locomotion was observed, significant difference between noncarrier (n = 6) and A53T-Tg (n = 12) rats was found in locomotion scores (p = 0.012). Locomotion and rearing scores in noncarrier rats also continually decreased with age during the present experimental period. Details of motor activity scores in noncarrier and A53T-Tg rats are shown in Table 1.
Figure 3.
General motor activities in noncarrier and A53T-Tg rats. A, B, Locomotion (number of square crossings per min; A) and rearing (number of times per min; B) scores in 4- to 16-month-old noncarrier (n = 6; open circles) and A53T-Tg (n = 12; filled circles) rats. C, Correlation between weight gain and locomotion in animals for PET experiments. *p < 0.05 (two-way ANOVA). Correlation coefficients (r), p values, and R2 values are shown adjacent to the scatter plot.
Table 1.
Data for general motor activities of noncarrier and A53T-Tg rats (mean ± SE)
| Age (months) |
||||||||
|---|---|---|---|---|---|---|---|---|
| 4 | 5 | 6 | 8 | 10 | 12 | 14 | 16 | |
| Noncarrier (n = 6) | ||||||||
| Weight (g) | 283 ± 11.6 | 293 ± 8.5 | 304 ± 15.2 | 318 ± 12.9 | 343 ± 15.2 | 368 ± 12.4 | 360 ± 11.6 | 387 ± 14.6 |
| Locomotion (crossing/min) | 14.7 ± 1.30 | 12.2 ± 2.41 | 13.4 ± 0.95 | 12.1 ± 0.83 | 11.2 ± 1.06 | 11.1 ± 2.05 | 9.64 ± 1.28 | 8.6 ± 1.38 |
| Rearing (times/min) | 3.73 ± 0.22 | 3.53 ± 1.21 | 3.36 ± 0.80 | 3.25 ± 0.30 | 2.6 ± 0.35 | 2.48 ± 0.25 | 2.3 ± 0.59 | 2.3 ± 0.73 |
| A53T-Tg (n = 12) | ||||||||
| Weight (g) | 294 ± 9.8 | 311 ± 13.8 | 337 ± 10.2 | 354 ± 13.7 | 354 ± 12.8 | 415 ± 31.5 | 409 ± 36.7 | 447 ± 28.6 |
| Locomotion (crossing/min) | 13.9 ± 1.43 | 17.1 ± 1.92 | 14.3 ± 1.73 | 8.05 ± 1.45 | 7.04 ± 1.24 | 5.9 ± 0.58 | 4.53 ± 0.76 | 4.07 ± 0.82 |
| Rearing (times/min) | 4.04 ± 0.54 | 4.84 ± 0.80 | 3.71 ± 0.78 | 2.08 ± 0.39 | 1.64 ± 0.44 | 1.43 ± 0.47 | 0.93 ± 0.20 | 0.67 ± 0.27 |
Immunohistochemistry
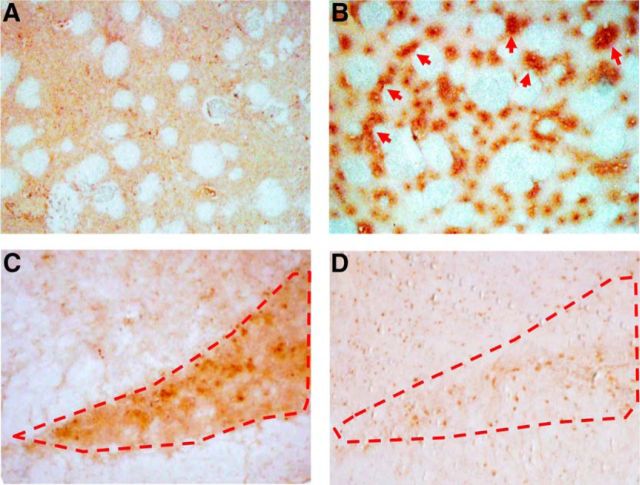
Representative images of brain sections stained by immunohistochemistry from noncarrier and A53T-Tg rats at 16 months are shown in Figure 4. Human ASN immunoreactivities were highly prominent in the striatum of A53T-Tg rats; partial signal aggregations were also detected (Fig. 4B). Additionally, striatal synaptic gaps in A53T-Tg rats were expanded compared with those of noncarrier rats, indicating that dopaminergic neuronal degeneration had occurred. High immunoreactivity for TH was observed in the substantia nigra of noncarrier rats. In contrast, immunoreactivity for TH in A53T-Tg rats was low, which also supported degeneration of dopaminergic neurons in A53T-Tg rats aged 16 months (Fig. 4D).
Figure 4.
A–D, Representative immunohistochemical images for human ASN and TH on brain sections of noncarrier (16-month-old; A, C) and A53T-Tg (16-month-old; B, D) rats. Brain sections containing the caudate/putamen (A, B) and substantia nigra (C, D) were prepared. Red arrows indicate notable human ASN aggregation. Dotted red lines show the area of the substantia nigra.
Longitudinal PET imaging for group I mGluRs and DAT in the striatum
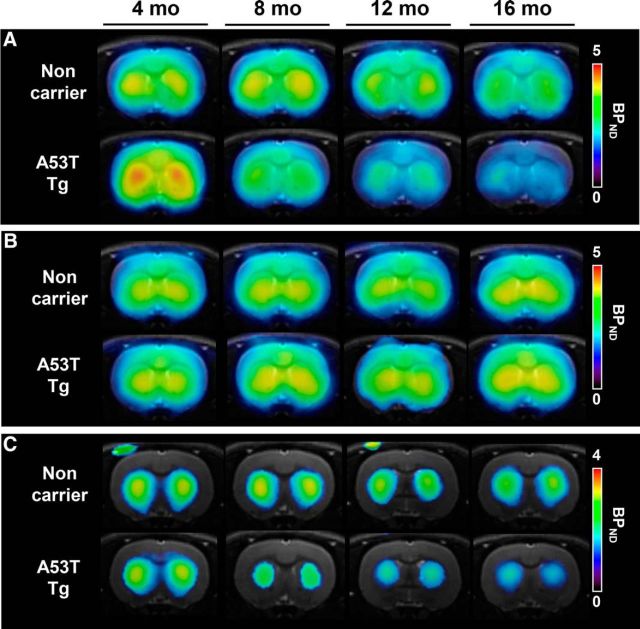
Parametric PET images obtained using the radioligands [11C]ITDM, (E)-[11C]ABP688, and [18F]FE-PE2I in noncarrier and A53T-Tg rats at different ages (4, 8, 12, and 16 months) are shown in Figure 5. In 4-month-old A53T-Tg rats, BPND-scaled [11C]ITDM signals in the striatum were higher than those in noncarrier rats, indicating elevated levels of mGluR1; dramatic signal decreases were subsequently detected at 8 to 16 months in A53T-Tg rats. However, among noncarrier rats, striatal [11C]ITDM BPND signals only showed a slight decline with age (Fig. 5A). No differences were detected in (E)-[11C]ABP688 BPND-scaled signals between noncarrier and A53T-Tg rats, indicating mGluR5 exhibited similar levels between groups; additionally, no signal changes occurred with age (Fig. 5B). We used [18F]FE-PE2I to detect DAT, a known biomarker for dopaminergic neurons. In A53T-Tg rats, BPND-scaled striatal [18F]FE-PE2I signals showed age-dependent decreases. Striatal signal area sizes in A53T-Tg rats also diminished with age. However, BPND-scaled [18F]FE-PE2I signals in noncarrier rats maintained constant values during the experimental term, with unchanging striatal area sizes (Fig. 5C).
Figure 5.
Representative parametric PET and MRI images for mGluR1, mGluR5, and DAT at 4, 8, 12, and 16 months in the striatum of the same noncarrier (top) and A53T-Tg (bottom) rats. A, Parametric images based on mGluR1 BPND using [11C]ITDM. B, Parametric images based on mGluR5 BPND using (E)-[11C]ABP688. C, Parametric images based on BPND using [18F]FE-PE2I. All slices were located −0.12 mm from bregma.
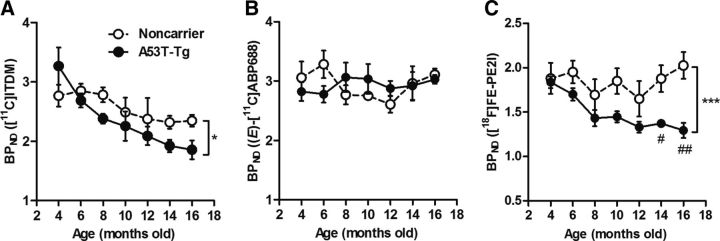
The longitudinal striatal BPND values for [11C]ITDM, (E)-[11C]ABP688, and [18F]FE-PE2I binding are shown in Figure 6. In noncarrier rats, [11C]ITDM BPND values were maintained at ∼2.8 between 4 and 8 months, and then showed a moderate decrease with age. The final BPND value (at 16 months) in the noncarrier rat group was 2.3, indicating a 15% reduction from values at 4 months. In A53T-Tg rats, the initial [11C]ITDM BPND value at 4 months (3.3) was higher than that for the noncarrier group, which then sharply decreased with age: at 16 months, the A53T-Tg group BPND value showed a 43% decline (1.9) compared with A53T-Tg rats at 4 months. The dynamic changes of [11C]ITDM BPND in A53T-Tg group were also significantly larger than that in the noncarrier group (p = 0.049). In contrast, (E)-[11C]ABP688 BPND values (indicating mGluR5 levels) in both groups were maintained at values of ∼3 during the experimental term, and no differences (p > 0.05) between groups were identified at any experimental age. At 12 to 16 months, (E)-[11C]ABP688 BPND values tended to increase in noncarrier rats; however, there were no significant differences (p > 0.05) between groups. At 4 months, [18F]FE-PE2I BPND values were 1.9 and 1.8 for noncarrier and A53T-Tg rats, respectively. Among A53T-Tg rats, [18F]FE-PE2I BPND values dramatically decreased with age and showed significant differences from those in age-matched noncarrier groups (p < 0.0001). In contrast, values for noncarrier rats slightly declined until they reached 12 months of age, and tended to increase afterward. The overall [18F]FE-PE2I BPND signal in A53T-Tg rats decreased by 29% from 4 to 16 months.
Figure 6.
Dynamic changes in striatal BPND values in 4- to 16-month-old noncarrier and A53T-Tg rats. A, BPND values represent mGluR1-specific binding to [11C]ITDM (48–67 MBq, 0.2–0.9 nmol). B, BPND values represent mGluR5-specific binding to (E)-[11C]ABP688 (40–54 MBq, 0.1–0.6 nmol). C, BPND values represent DAT-specific binding to [18F]FE-PE2I (11–16 MBq, 0.1–1.2 nmol). *p < 0.05, ***p < 0.001 (two-way ANOVAs); #p < 0.05, ##p < 0.01 (post hoc analyses). For noncarrier rats, n = 4 per time point. For A53T-Tg rats, n = 6 at 4, 6, 8, and 10 months; n = 4 at 12, 14, and 16 months.
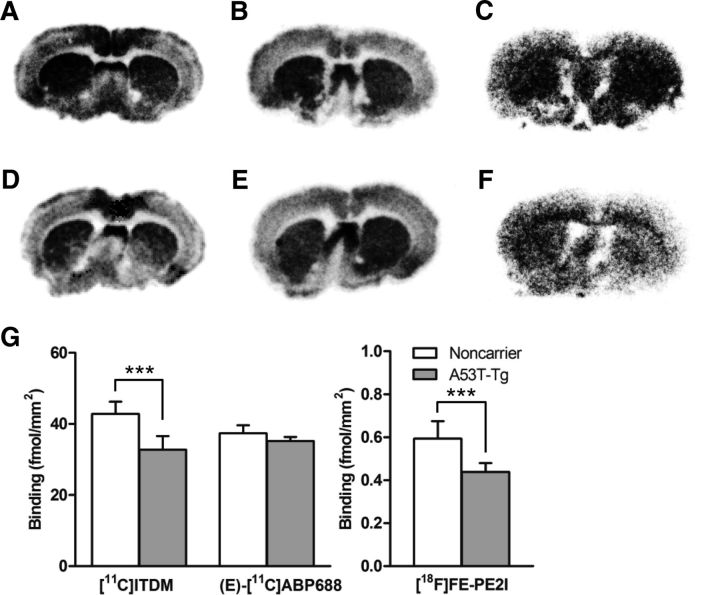
To validate changes in BPND values in PET studies, in vitro autoradiography was performed using brain sections from 16-month-old rats. As shown in Figure 7, striatal binding of [11C]ITDM (p < 0.0001) and [18F]FE-PE2I (p = 0.0002) in autoradiograms from A53T-Tg rat brain sections were significantly lower than those of noncarrier rat brain sections. In contrast, there was no difference (p = 0.0805) in striatal binding of (E)-[11C]ABP688 between groups. These in vitro results strongly support that the in vivo decline of [11C]ITDM and [18F]FE-PE2I BPNDs in the striatum of A53T-Tg rat reflected decrease of mGluR1 and DAT densities.
Figure 7.
A–D, In vitro autoradiography using noncarrier (A–C) and A53T-Tg (D–F) rat brain sections. A, D, Autoradiograms use [11C]ITDM (18 MBq, 1.0 nm) for mGluR1. B, E, Autoradiograms use (E)-[11C]ABP688 (6 MBq, 0.4 nm) for mGluR5. C, F, Autoradiograms use [18F]FE-PE2I (0.7 MBq, 16.5 pm) for DAT. G, Quantitative measurements (femtomoles per square millimeter) of binding for each radioligand on brain sections. ***p < 0.001 (Student's t test).
Correlation between general motor activities and striatal BPND values for radioligands
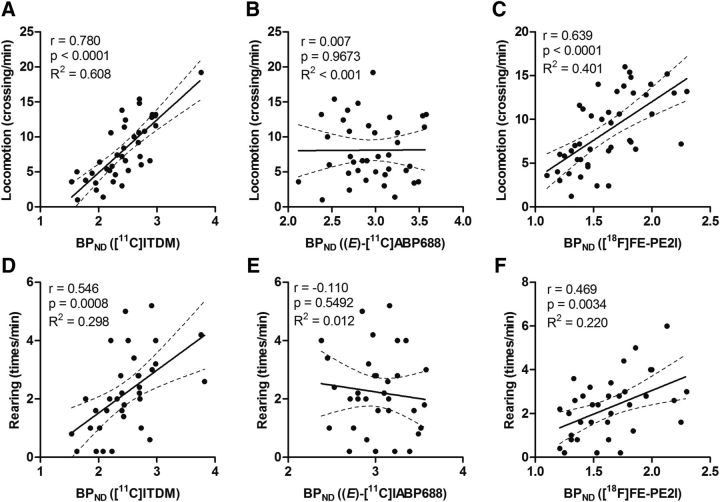
Scatter plots between motor activities (locomotion and rearing) and striatal BPND values for [11C]ITDM, (E)-[11C]ABP688, and [18F]FE-PE2I are shown in Figure 8. BPND values for [11C]ITDM had the highest correlation with motor activities (indicating an association with mGluR1), with correlation coefficients (r) of 0.780 (p < 0.0001) and 0.546 (p = 0.0008) for locomotion and rearing, respectively. Relatively high correlations were also found between locomotion (r = 0.639, p < 0.0001) or rearing (r = 0.469, p = 0.0034) and [18F]FE-PE2I BPND values, indicating an association with DAT levels. However, no correlation (locomotion, r = 0.007, p = 0.9673; rearing, r = –0.110, p = 0.5492) was observed between motor activities and mGluR5-related (E)-[11C]ABP688 BPND values.
Figure 8.
Scatter plots between general motor activities and BPND values. A, Locomotion plotted against [11C]ITDM BPND values specific to mGluR1. B, Locomotion plotted against (E)-[11C]ABP688 BPND values specific to mGluR5. C, Locomotion plotted against [18F]FE-PE2I BPND values specific to DAT. D, Rearing plotted against [11C]ITDM BPND values specific to mGluR1. E, Rearing plotted against (E)-[11C]ABP688 BPND values specific to mGluR5. F, Rearing plotted against [18F]FE-PE2I BPND values specific to DAT. The regression lines in each graph show the 95% confidence intervals (dotted lines). Respective correlation coefficients (r), p values, and R2 values are shown adjacent to each scatter plot.
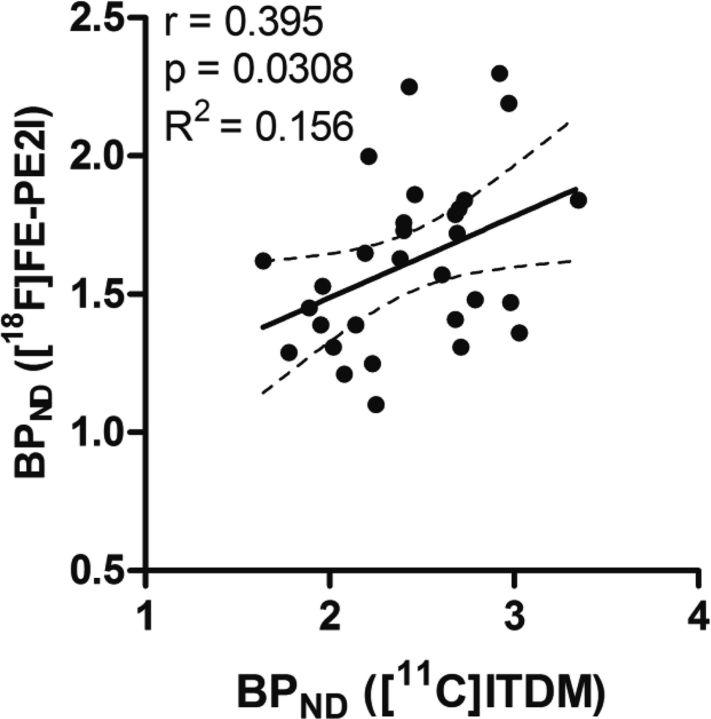
To identify whether declines in mGluR1 levels were associated with dopaminergic neuron degeneration, scatter plot analyses between [11C]ITDM and [18F]FE-PE2I BPND values were performed. Figure 9 shows scatter plots with a linear regression between binding data for mGluR1 and DAT. A correlation coefficient of 0.395 (p = 0.0308) was detected between [11C]ITDM and [18F]FE-PE2I BPND values, suggesting that the decline in mGluR1 levels was partially correlated with dopaminergic neuron degeneration.
Figure 9.
Scatter plot depicting BPND values compared between with [11C]ITDM (specific to mGluR1) and [18F]FE-PE2I (specific to DAT). The regression line shows 95% confidence intervals (dotted lines). The correlation coefficient (r), p value, and R2 value from our analysis are shown adjacent to the scatter plot.
Dynamic changes of [11C]ITDM BPND values in brain regions of A53T-Tg rats.
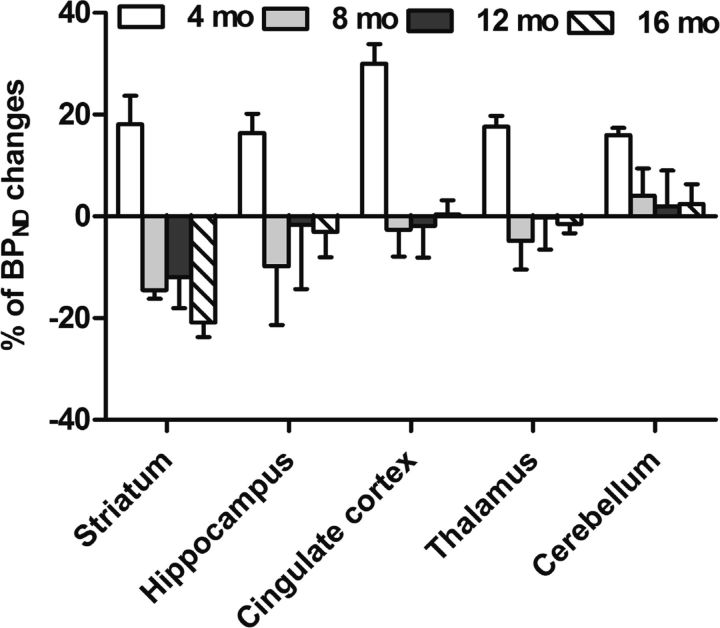
The percentage change in [11C]ITDM BPND values with age (4, 8, 12, and 16 months) in the striatum, hippocampus, cingulate cortex, thalamus, and cerebellum in A53T-Tg rats compared with noncarrier rats is shown in Figure 10. The BPND values in all brain regions of A53T-Tg rats increased 15–30% at 4 months compared with noncarrier rats, and then recovered to a similar level in the cingulate cortex, thalamus, and cerebellum compared with noncarrier rats. In contrast, BPND values in the striatum and hippocampus decreased by 10–15% during 4–8 months compared with noncarrier rats. BPND values in the hippocampus recovered to noncarrier rat levels, whereas striatal BPND values continued to decrease with age.
Figure 10.
Percentage of regional change in BPND with [11C]ITDM in A53T-Tg rats at 4, 8, 12, and 16 months compared with same-aged noncarrier rats. Regions of interest were selected on mGluR1-rich regions, such as the striatum, hippocampus, cingulate cortex, thalamus, and cerebellum.
Evaluation of cerebellar [11C]ITDM BPND values in noncarrier and A53T-Tg rats
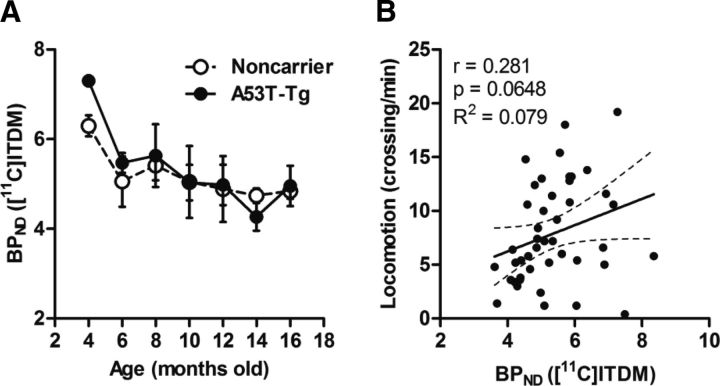
To confirm whether changes in cerebellar mGluR1 levels, which express with the highest density in the rat brain, are related to PD progression, scatter plot analyses were performed across ages comparing cerebellar mGluR1 BPND values and locomotion scores for noncarrier and A53T-Tg rats. Longitudinal changes in cerebellar [11C]ITDM BPND values and their correlation with locomotion are shown in Figure 11. Cerebellar [11C]ITDM BPND values showed moderate decreases with age in both groups. Unlike striatal BPND values of [11C]ITDM, no differences between noncarrier and A53T-Tg rats were observed. Additionally, a relatively poor correlation (r = 0.281, p = 0.0648) was observed between locomotion and cerebellar BPND values of [11C]ITDM.
Figure 11.
Changes in cerebellar [11C]ITDM BPND. A, B, Cerebellar binding values for noncarrier and A53T-Tg rats are shown in relation to age (A) and as correlation plots against locomotion (B). The regression line shows 95% confidence intervals (dotted lines), with correlation coefficients (r), p values, and R2 values from our analysis. For noncarrier rats, n = 4 in each time point. For A53T-Tg rats, n = 6 at 4, 6, 8, and 10 months; n = 4 at 12, 14, and 16 months.
Discussion
In the present study, we demonstrated that dynamic changes occur in mGluR1, but not mGluR5 levels, in rat brains using a chronic-PD-model paradigm through longitudinal PET imaging. Interestingly, the changes in mGluR1 expression were strongly associated with the progression of PD pathology.
We used BPND values obtained by PET to quantitatively estimate the densities of target molecules in vivo. The BPND was obtained from PET imaging according to in vitro radioligand binding, which provided quantitative values that correspond to the target molecule (receptors, transporters, or enzymes) expression in the tissue (Mintun et al., 1984). The BPND was defined as the ratio of a specifically bound radioligand to that of a nondisplaceable (free and nonspecific binding) radioligand in the tissue at equilibrium state. This is a standard method used to measure the input function based on a target-negligible region as a reference, instead of using an artery blood-sampling method. The use of BPND values allows for convenient and noninvasive assessment of target molecule densities and enables longitudinal PET imaging. Previously, we demonstrated that BPND values based on PET with [11C]ITDM were highly correlated with immunohistochemical signals measuring mGluR1 expression in the brains of rodents (Yamasaki et al., 2014). In PET studies using (E)-[11C]ABP688, the BPND value was also frequently used to quantify mGluR5 expression in vivo (Wyckhuys et al., 2013; Choi et al., 2014; Mathews et al., 2014). Additionally, the [18F]FE-PE2I BPND value has been widely used as a biomarker for dopaminergic neurons in clinical PET studies (Sasaki et al., 2012; Kim et al., 2014; Suzuki et al., 2014). Thus, the previous reports provide strong evidence that BPND values can be used to quantitatively measure the mGluR1, mGluR5, and DAT densities in our present study.
Genetic aberrations in ASN, including point mutations (A53T, A30P, and E46K) and multiplications, have been linked to familial PD and Lewy-body dementia (Polymeropoulos et al., 1997). These mutations generally occur in the N-terminal amphipathic region of the protein, resulting in the formation of insoluble filaments. Among the various genetic aberrations, A53T is the most frequent mutation in familial Parkinsonism, and results in an earlier onset than that observed in most cases of sporadic PD (Cookson et al., 2005). In this study, we used mutant rats overexpressing human A53T-ASN as a chronic model of PD. Motor activities (as defined by behavioral scores) in A53T-Tg rats showed declines of ∼50% at 10 months, and at 16 months, most A53T-Tg rats exhibited significantly lower motor activities (Fig. 3). As assessed by immunohistochemistry, A53T-Tg rats with low motor activities showed abnormal aggregations of human ASN and degeneration of dopaminergic neurons in the striatum (Fig. 4).
In our longitudinal PET experiments, dynamic changes with age were observed in BPND values for [11C]ITDM, but not (E)-[11C]ABP688, in A53T-Tg rats (Figs. 5, 6). Interestingly, striatal [11C]ITDM BPND values were higher in A53T-Tg rats than noncarrier rats before onset of PD pathology, but subsequently decreased dramatically with age. These changes were highly correlated with dynamic changes in motor activities (Fig. 8). It was reported previously that abnormal ASN aggregation resulted in hypertrophy of striatal glutamatergic nerve terminals and increased glutamate release into the synaptic cleft (Nakata et al., 2012). Thus, the observed initial mGluR1 expression increases in 4-month-old A53T-Tg rats may be caused by the excessive glutamate release associated with abnormal ASN accumulation. Additionally, mGluR1 is prominently expressed in the dopaminergic neurons of the substantia nigra pars compacta, where subsequent activation facilitates somatodendritic dopamine release via intracellular calcium mobilization (Testa et al., 1994; Patel et al., 2009). Together, these data suggest that mGluR1 overactivations located on dopaminergic neurons stimulate excessive dopamine release and induce a transient increase in motor activity in young (4- to 5-month-old) A53T-Tg rats. However, [18F]FE-PE2I BPND values associated with DAT availability showed no change in relation to the temporary activation of motor activities before PD onset. This result suggests that dopamine increases without concurrent alterations in synaptic cleft DAT availability enhance neurotransmission, further stimulating dopamine signaling. Consequently, these abnormalities might induce dopaminergic neuron degeneration via unknown mechanisms. More importantly, these data suggest that the dynamic decline we observed in mGluR1 expression reflected the subsequent activation and degeneration of dopaminergic neurons.
Although dramatic decreases in striatal mGluR1 after PD onset were shown in A53T-Tg rats, gradual declines in mGluR1 expression were exhibited in the noncarrier rat with age. The age-dependent reduction in the functional responses of striatal group I metabotropic glutamate receptors was demonstrated previously (Pintor et al., 2000). It was also reported that mGluR5 protein expression in brain regions remained unchanged during aging (Simonyi et al., 2005). Thus, these reports are consistent with our findings that expression of mGluR1, but not mGluR5, decreased by unknown mechanisms associated with aging. Interestingly, although the observed mGluR1 expression decline in the cerebellum, the mGluR1-richest region without dopaminergic neurons, was poorly correlated with motor activities (Fig. 11), striatal mGluR1 decreases were highly correlated with motor activities. Thus, striatal mGluR1 expression is a potential in vivo biomarker for PD diagnosis.
Previously, multi-PET studies for dopaminergic neurons and mGluR5 were performed using 6-OHDA-lesioned rats as an acute PD model (Pellegrino et al., 2007). In the study by Pellegrino et al. (2007), BPND values for mGluR5 in the lesioned side of the striatum increased concurrently with dopaminergic neuron degeneration. However, in the present study, striatal mGluR5 BPND values in rats with aggregated abnormal ASN remained unchanged during PD symptom progression. In the acute model, mGluR5 expression upregulation may be the result of signaling cascades that induce neuronal death. In accordance with this view, mGluR5 knock-out mice have decreased dopaminergic neuron degeneration following 6-OHDA treatment (Black et al., 2010). Together, these data suggest that mGluR1 and mGluR5 may have distinct functions in acute, compared with chronic, toxicity in the CNS. The present findings contribute to the understanding of pathogenic mechanisms in several CNS disorders and suggest mGluR1 may be a potential therapeutic target for PD.
At present, several studies have reported a decline in DAT density among aged rodents (Himi et al., 1995; Salvatore et al., 2003; Niñerola-Baizán et al., 2015). We reported a gradual decrease in [18F]FE-PE2I BPND values among noncarrier rats until they were 12 months old, which then increased until the age of 16 months. However, reported BPND values from noncarrier rats showed large error margins, particularly among rats that were 8 and 12 months old. Additionally, no obvious age-dependent decline in DAT availability was detected before middle age in the Sprague Dawley rat strain. More importantly, the [18F]FE-PE2I BPND values from A53T-Tg rats reflected DAT availability and corresponded with PD pathology.
In conclusion, in this longitudinal PET study, we have demonstrated for the first time that dynamic changes associated with PD progression occur in the expression of mGluR1, but not mGluR5, in a chronic PD model of rats that mimics clinical pathology. We therefore suggest that mGluR1 is a useful in vivo biomarker to further the understanding of pathological mechanisms in PD. These findings may also facilitate the development of pharmaceuticals targeting mGluR1 for the treatment of PD and many other CNS disorders.
Footnotes
This work was supported by the Japan Society for the Promotion of Science KAKENHI Grant 25861135. A53T-Tg and noncarrier rats were purchased for research purposes under a simple label license agreement with Cornell University. We thank the staff of the National Institute of Radiological Sciences for their support with cyclotron operation, radioisotope production, radiosynthesis, and animal experiments.
The authors declare no competing financial interests.
References
- Abe T, Sugihara H, Nawa H, Shigemoto R, Mizuno N, Nakanishi S. Molecular characterization of a novel metabotropic glutamate receptor mGluR5 coupled to inositol phosphate/Ca2+ signal transduction. J Biol Chem. 1992;267:13361–13368. [PubMed] [Google Scholar]
- Aguirre JA, Andbjer B, González-Barón S, Hansson A, Strömberg I, Agnati LF, Fuxe K. Group I mGluR antagonist AIDA protects nigral DA cells from MPTP-induced injury. Neuroreport. 2001;12:2615–2617. doi: 10.1097/00001756-200108280-00006. [DOI] [PubMed] [Google Scholar]
- Aramori I, Nakanishi S. Signal transduction and pharmacological characteristics of a metabotropic glutamate receptor, mGluR1, in transfected CHO cells. Neuron. 1992;8:757–765. doi: 10.1016/0896-6273(92)90096-V. [DOI] [PubMed] [Google Scholar]
- Bao WL, Williams AJ, Faden AI, Tortella FC. Selective mGluR5 receptor antagonist or agonist provides neuroprotection in a rat model of focal cerebral ischemia. Brain Res. 2001;922:173–179. doi: 10.1016/S0006-8993(01)03062-1. [DOI] [PubMed] [Google Scholar]
- Black YD, Xiao D, Pellegrino D, Kachroo A, Brownell AL, Schwarzschild MA. Protective effect of metabotropic glutamate mGluR5 receptor elimination in a 6-hydroxydopamine model of Parkinson's disease. Neurosci Lett. 2010;486:161–165. doi: 10.1016/j.neulet.2010.09.043. [DOI] [PMC free article] [PubMed] [Google Scholar]
- Choi H, Kim YK, Oh SW, Im HJ, Hwang do W, Kang H, Lee B, Lee YS, Jeong JM, Kim EE, Chung JK, Lee DS. In vivo imaging of mGluR5 changes during epileptogenesis using [11C]ABP688 PET in pilocarpine-induced epilepsy rat model. PLoS One. 2014;9:e92765. doi: 10.1371/journal.pone.0092765. [DOI] [PMC free article] [PubMed] [Google Scholar]
- Cookson MR, Xiromerisiou G, Singleton A. How genetics research in Parkinson's disease is enhancing understanding of the common idiopathic forms of the disease. Current Opinion in Neurology. 2005;18:706–711. doi: 10.1097/01.wco.0000186841.43505.e6. [DOI] [PubMed] [Google Scholar]
- Dekundy A, Pietraszek M, Schaefer D, Cenci MA, Danysz W. Effects of group I metabotropic glutamate receptors blockade in experimental models of Parkinson's disease. Brain Res Bull. 2006;69:318–326. doi: 10.1016/j.brainresbull.2005.12.009. [DOI] [PubMed] [Google Scholar]
- De Leonibus E, Managò F, Giordani F, Petrosino F, Lopez S, Oliverio A, Amalric M, Mele A. Metabotropic glutamate receptors 5 blockade reverses spatial memory deficits in a mouse model of Parkinson's disease. Neuropsychopharmacology. 2009;34:729–738. doi: 10.1038/npp.2008.129. [DOI] [PubMed] [Google Scholar]
- Elmenhorst D, Minuzzi L, Aliaga A, Rowley J, Massarweh G, Diksic M, Bauer A, Rosa-Neto P. In vivo and in vitro validation of reference tissue models for the mGluR5 ligand [11C]ABP688. J Cereb Blood Flow Metab. 2010;30:1538–1549. doi: 10.1038/jcbfm.2010.65. [DOI] [PMC free article] [PubMed] [Google Scholar]
- Ferraguti F, Crepaldi L, Nicoletti F. Metabotropic glutamate 1 receptor: current concepts and perspectives. Pharmacol Rev. 2008;60:536–581. doi: 10.1124/pr.108.000166. [DOI] [PubMed] [Google Scholar]
- Fotuhi M, Sharp AH, Glatt CE, Hwang PM, von Krosigk M, Snyder SH, Dawson TM. Differential localization of phosphoinositide-linked metabotropic glutamate receptor (mGluR1) and the inositol 1,4,5-trisphosphate receptor in rat brain. J Neurosci. 1993;13:2001–2012. doi: 10.1523/JNEUROSCI.13-05-02001.1993. [DOI] [PMC free article] [PubMed] [Google Scholar]
- Francesconi A, Duvoisin RM. Role of the second and third intracellular loops of metabotropic glutamate receptors in mediating dual signal transduction activation. J Biol Chem. 1998;273:5615–5624. doi: 10.1074/jbc.273.10.5615. [DOI] [PubMed] [Google Scholar]
- Fujinaga M, Yamasaki T, Maeda J, Yui J, Xie L, Nagai Y, Nengaki N, Hatori A, Kumata K, Kawamura K, Zhang MR. Development of N-[4-[6-(isopropylamino)pyrimidin-4-yl]-1,3-thiazol-2-yl]-N-methyl-4-[11C]methylb enzamide for positron emission tomography imaging of metabotropic glutamate 1 receptor in monkey brain. J Med Chem. 2012;55:11042–11051. doi: 10.1021/jm301597s. [DOI] [PubMed] [Google Scholar]
- Himi T, Cao M, Mori N. Reduced expression of the molecular markers of dopaminergic neuronal atrophy in the aging rat brain. J Gerontol A Biol Sci Med Sci. 1995;50:B193–B200. doi: 10.1093/gerona/50a.4.b193. [DOI] [PubMed] [Google Scholar]
- Kaneda K, Tachibana Y, Imanishi M, Kita H, Shigemoto R, Nambu A, Takada M. Down-regulation of metabotropic glutamate receptor 1alpha in globus pallidus and substantia nigra of parkinsonian monkeys. Eur J Neurosci. 2005;22:3241–3254. doi: 10.1111/j.1460-9568.2005.04488.x. [DOI] [PubMed] [Google Scholar]
- Kawamura K, Yamasaki T, Kumata K, Furutsuka K, Takei M, Wakizaka H, Fujinaga M, Kariya K, Yui J, Hatori A, Xie L, Shimoda Y, Hashimoto H, Hayashi K, Zhang MR. Binding potential of (E)-[11C]ABP688 to metabotropic glutamate receptor subtype 5 is decreased by the inclusion of its 11C-labelled Z-isomer. Nucl Med Biol. 2014;41:17–23. doi: 10.1016/j.nucmedbio.2013.09.008. [DOI] [PubMed] [Google Scholar]
- Kim W, Tateno A, Arakawa R, Sakayori T, Ikeda Y, Suzuki H, Okubo Y. In vivo activity of modafinil on dopamine transporter measured with positron emission tomography and [18F]FE-PE2I. Int J Neuropsychopharmacol. 2014;17:697–703. doi: 10.1017/S1461145713001612. [DOI] [PubMed] [Google Scholar]
- Kohara A, Takahashi M, Yatsugi S, Tamura S, Shitaka Y, Hayashibe S, Kawabata S, Okada M. Neuroprotective effects of the selective type 1 metabotropic glutamate receptor antagonist YM-202074 in rat stroke models. Brain Res. 2008;1191:168–179. doi: 10.1016/j.brainres.2007.11.035. [DOI] [PubMed] [Google Scholar]
- Lammertsma AA, Hume SP. Simplified reference tissue model for PET receptor studies. Neuroimage. 1996;4:153–158. doi: 10.1006/nimg.1996.0066. [DOI] [PubMed] [Google Scholar]
- Logan J, Fowler JS, Volkow ND, Wang GJ, Ding YS, Alexoff DL. Distribution volume ratios without blood sampling from graphical analysis of PET data. J Cereb Blood Flow Metab. 1996;16:834–840. doi: 10.1097/00004647-199609000-00008. [DOI] [PubMed] [Google Scholar]
- Löscher W, Dekundy A, Nagel J, Danysz W, Parsons CG, Potschka H. mGlu1 and mGlu5 receptor antagonists lack anticonvulsant efficacy in rodent models of difficult-to-treat partial epilepsy. Neuropharmacology. 2006;50:1006–1015. doi: 10.1016/j.neuropharm.2006.02.001. [DOI] [PubMed] [Google Scholar]
- Mathews WB, Kuwabara H, Stansfield K, Valentine H, Alexander M, Kumar A, Hilton J, Dannals RF, Wong DF, Gasparini F. Dose-dependent, saturable occupancy of the metabotropic glutamate subtype 5 receptor by fenobam as measured with [11C]ABP688 PET imaging. Synapse. 2014 doi: 10.1002/syn.21775. Advance online publication. [DOI] [PMC free article] [PubMed] [Google Scholar]
- Mintun MA, Raichle ME, Kilbourn MR, Wooten GF, Welch MJ. A quantitative model for the in vivo assessment of drug binding sites with positron emission tomography. Ann Neurol. 1984;15:217–227. doi: 10.1002/ana.410150302. [DOI] [PubMed] [Google Scholar]
- Nakanishi S, Nakajima Y, Masu M, Ueda Y, Nakahara K, Watanabe D, Yamaguchi S, Kawabata S, Okada M. Glutamate receptors: brain function and signal transduction. Brain Res Rev. 1998;26:230–235. doi: 10.1016/S0165-0173(97)00033-7. [DOI] [PubMed] [Google Scholar]
- Nakata Y, Yasuda T, Fukaya M, Yamamori S, Itakura M, Nihira T, Hayakawa H, Kawanami A, Kataoka M, Nagai M, Sakagami H, Takahashi M, Mizuno Y, Mochizuki H. Accumulation of alpha-synuclein triggered by presynaptic dysfunction. J Neurosci. 2012;32:17186–17196. doi: 10.1523/JNEUROSCI.2220-12.2012. [DOI] [PMC free article] [PubMed] [Google Scholar]
- Niñerola-Baizán A, Rojas S, Roé-Vellvé N, Lomeña F, Ros D, Pavía J. Dopamine transporter imaging in the aged rat: a [123I]FP-CIT SPECT study. Nucl Med Biol. 2015;42:395–398. doi: 10.1016/j.nucmedbio.2014.12.020. [DOI] [PubMed] [Google Scholar]
- Patel JC, Witkovsky P, Avshalumov MV, Rice ME. Mobilization of calcium from intracellular stores facilitates somatodendritic dopamine release. J Neurosci. 2009;29:6568–6579. doi: 10.1523/JNEUROSCI.0181-09.2009. [DOI] [PMC free article] [PubMed] [Google Scholar]
- Pellegrino D, Cicchetti F, Wang X, Zhu A, Yu M, Saint-Pierre M, Brownell AL. Modulation of dopaminergic and glutamatergic brain function: PET studies on parkinsonian rats. J Nucl Med. 2007;48:1147–1153. doi: 10.2967/jnumed.106.037796. [DOI] [PubMed] [Google Scholar]
- Pintor A, Potenza RL, Domenici MR, Tiburzi F, Reggio R, Pèzzola A, Popoli P. Age-related decline in the functional response of striatal group I mGlu receptors. Neuroreport. 2000;11:3033–3038. doi: 10.1097/00001756-200009110-00041. [DOI] [PubMed] [Google Scholar]
- Polymeropoulos MH, Lavedan C, Leroy E, Ide SE, Dehejia A, Dutra A, Pike B, Root H, Rubenstein J, Boyer R, Stenroos ES, Chandrasekharappa S, Athanassiadou A, Papapetropoulos T, Johnson WG, Lazzarini AM, Duvoisin RC, Di Iorio G, Golbe LI, Nussbaum RL. Mutation in the alpha-synuclein gene identified in families with Parkinson's disease. Science. 1997;276:2045–2047. doi: 10.1126/science.276.5321.2045. [DOI] [PubMed] [Google Scholar]
- Roberts HL, Brown DR. Seeking a mechanism for the toxicity of oligomeric alpha-synuclein. Biomolecules. 2015;5:282–305. doi: 10.3390/biom5020282. [DOI] [PMC free article] [PubMed] [Google Scholar]
- Rylander D, Iderberg H, Li Q, Dekundy A, Zhang J, Li H, Baishen R, Danysz W, Bezard E, Cenci MA. A mGluR5 antagonist under clinical development improves L-DOPA-induced dyskinesia in parkinsonian rats and monkeys. Neurobiol Dis. 2010;39:352–361. doi: 10.1016/j.nbd.2010.05.001. [DOI] [PubMed] [Google Scholar]
- Salvatore MF, Apparsundaram S, Gerhardt GA. Decreased plasma membrane expression of striatal dopamine transporter in aging. Neurobiol Aging. 2003;24:1147–1154. doi: 10.1016/S0197-4580(03)00129-5. [DOI] [PubMed] [Google Scholar]
- Samadi P, Grégoire L, Morissette M, Calon F, Hadj Tahar A, Dridi M, Belanger N, Meltzer LT, Bédard PJ, Di Paolo T. mGluR5 metabotropic glutamate receptors and dyskinesias in MPTP monkeys. Neurobiol Aging. 2008;29:1040–1051. doi: 10.1016/j.neurobiolaging.2007.02.005. [DOI] [PubMed] [Google Scholar]
- Sanchez-Pernaute R, Wang JQ, Kuruppu D, Cao L, Tueckmantel W, Kozikowski A, Isacson O, Brownell AL. Enhanced binding of metabotropic glutamate receptor type 5 (mGluR5) PET tracers in the brain of parkinsonian primates. Neuroimage. 2008;42:248–251. doi: 10.1016/j.neuroimage.2008.04.170. [DOI] [PMC free article] [PubMed] [Google Scholar]
- Sasaki T, Ito H, Kimura Y, Arakawa R, Takano H, Seki C, Kodaka F, Fujie S, Takahata K, Nogami T, Suzuki M, Fujiwara H, Takahashi H, Nakao R, Fukumura T, Varrone A, Halldin C, Nishikawa T, Suhara T. Quantification of dopamine transporter in human brain using PET with 18F-FE-PE2I. J Nucl Med. 2012;53:1065–1073. doi: 10.2967/jnumed.111.101626. [DOI] [PubMed] [Google Scholar]
- Schiefer J, Sprünken A, Puls C, Lüesse HG, Milkereit A, Milkereit E, Johann V, Kosinski CM. The metabotropic glutamate receptor 5 antagonist MPEP and the mGluR2 agonist LY379268 modify disease progression in a transgenic mouse model of Huntington's disease. Brain Res. 2004;1019:246–254. doi: 10.1016/j.brainres.2004.06.005. [DOI] [PubMed] [Google Scholar]
- Schou M, Steiger C, Varrone A, Guilloteau D, Halldin C. Synthesis, radiolabeling and preliminary in vivo evaluation of [18F]FE-PE2I, a new probe for the dopamine transporter. Bioorg Med Chem Lett. 2009;19:4843–4845. doi: 10.1016/j.bmcl.2009.06.032. [DOI] [PubMed] [Google Scholar]
- Simonyi A, Ngomba RT, Storto M, Catania MV, Miller LA, Youngs B, DiGiorgi-Gerevini V, Nicoletti F, Sun GY. Expression of groups I and II metabotropic glutamate receptors in the rat brain during aging. Brain Res. 2005;1043:95–106. doi: 10.1016/j.brainres.2005.02.046. [DOI] [PubMed] [Google Scholar]
- Suzuki M, Ito H, Kodaka F, Takano H, Kimura Y, Fujiwara H, Sasaki T, Takahata K, Nogami T, Nagashima T, Nengaki N, Kawamura K, Zhang MR, Varrone A, Halldin C, Okubo Y, Suhara T. Reproducibility of PET measurement for presynaptic dopaminergic functions using L-[beta-11C]DOPA and [18F]FE-PE2I in humans. Nucl Med Commun. 2014;35:231–237. doi: 10.1097/MNM.0000000000000052. [DOI] [PubMed] [Google Scholar]
- Tang FR, Chen PM, Tang YC, Tsai MC, Lee WL. Two-methyl-6-phenylethynyl-pyridine (MPEP), a metabotropic glutamate receptor 5 antagonist, with low doses of MK801 and diazepam: a novel approach for controlling status epilepticus. Neuropharmacology. 2007;53:821–831. doi: 10.1016/j.neuropharm.2007.08.012. [DOI] [PubMed] [Google Scholar]
- Testa CM, Standaert DG, Young AB, Penney JB., Jr Metabotropic glutamate receptor mRNA expression in the basal ganglia of the rat. J Neurosci. 1994;14:3005–3018. doi: 10.1523/JNEUROSCI.14-05-03005.1994. [DOI] [PMC free article] [PubMed] [Google Scholar]
- Ulus IH, Wurtman RJ. Metabotropic glutamate receptor agonists increase release of soluble amyloid precursor protein derivatives from rat brain cortical and hippocampal slices. J Pharmacol Exp Ther. 1997;281:149–154. [PubMed] [Google Scholar]
- Vernon AC, Zbarsky V, Datla KP, Croucher MJ, Dexter DT. Subtype selective antagonism of substantia nigra pars compacta Group I metabotropic glutamate receptors protects the nigrostriatal system against 6-hydroxydopamine toxicity in vivo. J Neurochem. 2007;103:1075–1091. doi: 10.1111/j.1471-4159.2007.04860.x. [DOI] [PubMed] [Google Scholar]
- Vernon AC, Croucher MJ, Dexter DT. Additive neuroprotection by metabotropic glutamate receptor subtype-selective ligands in a rat Parkinson's model. Neuroreport. 2008;19:475–478. doi: 10.1097/WNR.0b013e3282f602df. [DOI] [PubMed] [Google Scholar]
- Wyckhuys T, Verhaeghe J, Wyffels L, Langlois X, Schmidt M, Stroobants S, Staelens S. N-acetylcysteine- and MK-801-induced changes in glutamate levels do not affect in vivo binding of metabotropic glutamate 5 receptor radioligand 11C-ABP688 in rat brain. J Nucl Med. 2013;54:1954–1961. doi: 10.2967/jnumed.113.121608. [DOI] [PubMed] [Google Scholar]
- Yamasaki T, Fujinaga M, Yui J, Ikoma Y, Hatori A, Xie L, Wakizaka H, Kumata K, Nengaki N, Kawamura K, Zhang MR. Noninvasive quantification of metabotropic glutamate receptor type 1 with [11C]ITDM: a small-animal PET study. J Cereb Blood Flow Metab. 2014;34:606–612. doi: 10.1038/jcbfm.2013.243. [DOI] [PMC free article] [PubMed] [Google Scholar]
- Yui J, Hatori A, Kawamura K, Yanamoto K, Yamasaki T, Ogawa M, Yoshida Y, Kumata K, Fujinaga M, Nengaki N, Fukumura T, Suzuki K, Zhang MR. Visualization of early infarction in rat brain after ischemia using a translocator protein (18 kDa) PET ligand [11C]DAC with ultra-high specific activity. Neuroimage. 2011;54:123–130. doi: 10.1016/j.neuroimage.2010.08.010. [DOI] [PubMed] [Google Scholar]


