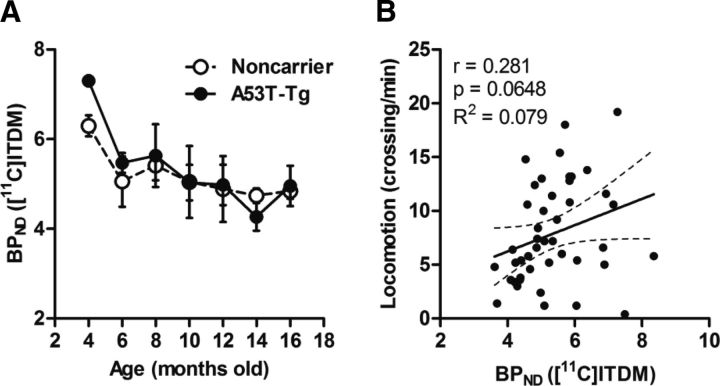
Figure 11.
Changes in cerebellar [11C]ITDM BPND. A, B, Cerebellar binding values for noncarrier and A53T-Tg rats are shown in relation to age (A) and as correlation plots against locomotion (B). The regression line shows 95% confidence intervals (dotted lines), with correlation coefficients (r), p values, and R2 values from our analysis. For noncarrier rats, n = 4 in each time point. For A53T-Tg rats, n = 6 at 4, 6, 8, and 10 months; n = 4 at 12, 14, and 16 months.

