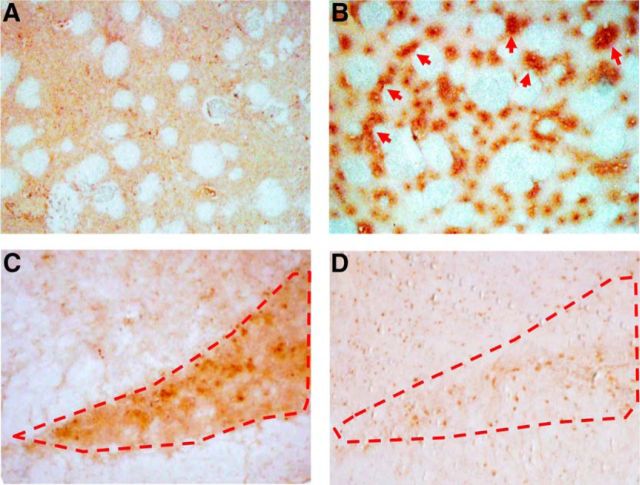
Figure 4.
A–D, Representative immunohistochemical images for human ASN and TH on brain sections of noncarrier (16-month-old; A, C) and A53T-Tg (16-month-old; B, D) rats. Brain sections containing the caudate/putamen (A, B) and substantia nigra (C, D) were prepared. Red arrows indicate notable human ASN aggregation. Dotted red lines show the area of the substantia nigra.

