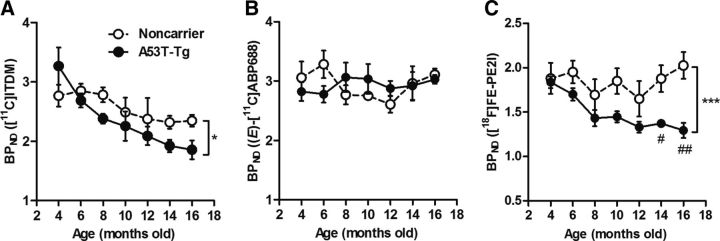
Figure 6.
Dynamic changes in striatal BPND values in 4- to 16-month-old noncarrier and A53T-Tg rats. A, BPND values represent mGluR1-specific binding to [11C]ITDM (48–67 MBq, 0.2–0.9 nmol). B, BPND values represent mGluR5-specific binding to (E)-[11C]ABP688 (40–54 MBq, 0.1–0.6 nmol). C, BPND values represent DAT-specific binding to [18F]FE-PE2I (11–16 MBq, 0.1–1.2 nmol). *p < 0.05, ***p < 0.001 (two-way ANOVAs); #p < 0.05, ##p < 0.01 (post hoc analyses). For noncarrier rats, n = 4 per time point. For A53T-Tg rats, n = 6 at 4, 6, 8, and 10 months; n = 4 at 12, 14, and 16 months.

