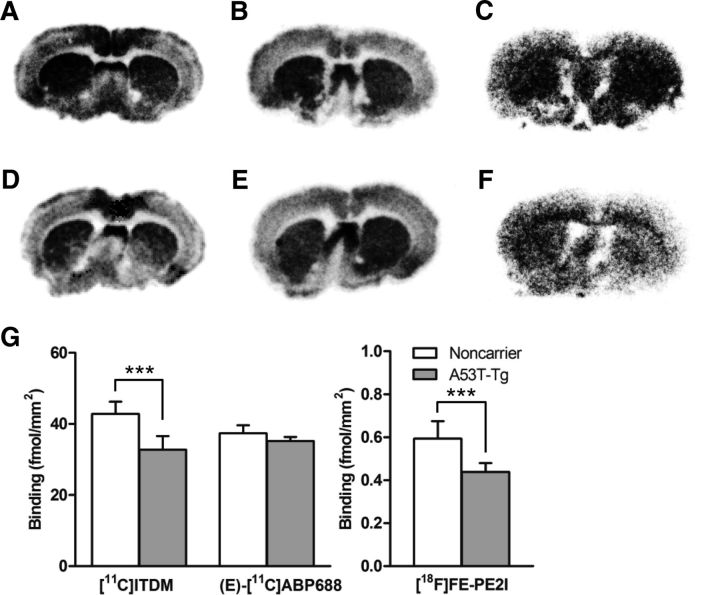
Figure 7.
A–D, In vitro autoradiography using noncarrier (A–C) and A53T-Tg (D–F) rat brain sections. A, D, Autoradiograms use [11C]ITDM (18 MBq, 1.0 nm) for mGluR1. B, E, Autoradiograms use (E)-[11C]ABP688 (6 MBq, 0.4 nm) for mGluR5. C, F, Autoradiograms use [18F]FE-PE2I (0.7 MBq, 16.5 pm) for DAT. G, Quantitative measurements (femtomoles per square millimeter) of binding for each radioligand on brain sections. ***p < 0.001 (Student's t test).

