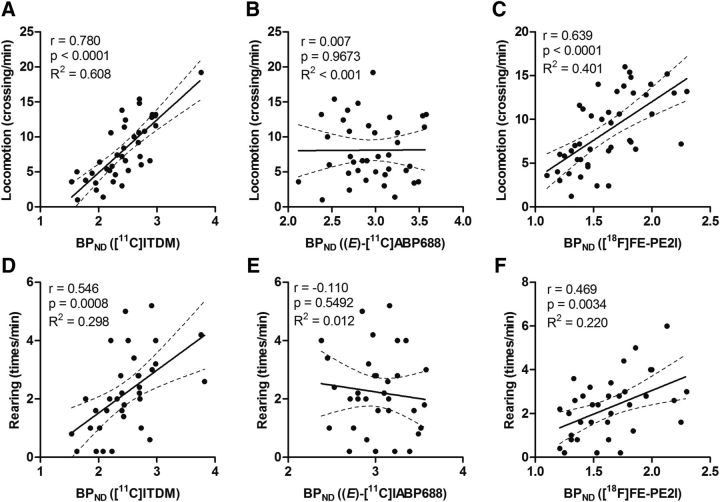
Figure 8.
Scatter plots between general motor activities and BPND values. A, Locomotion plotted against [11C]ITDM BPND values specific to mGluR1. B, Locomotion plotted against (E)-[11C]ABP688 BPND values specific to mGluR5. C, Locomotion plotted against [18F]FE-PE2I BPND values specific to DAT. D, Rearing plotted against [11C]ITDM BPND values specific to mGluR1. E, Rearing plotted against (E)-[11C]ABP688 BPND values specific to mGluR5. F, Rearing plotted against [18F]FE-PE2I BPND values specific to DAT. The regression lines in each graph show the 95% confidence intervals (dotted lines). Respective correlation coefficients (r), p values, and R2 values are shown adjacent to each scatter plot.

