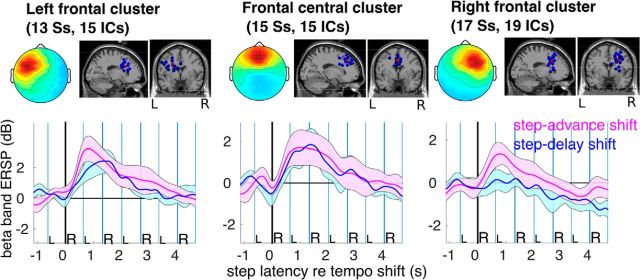
Figure 10.
β-band spectral perturbations in frontal clusters. Individual β frequency bands were selected for each individual subject as the frequency within the range 14–20 Hz having maximal ERSP power variance. For statistical analysis, mean β-band ERSP time courses time-locked to step-advance and step-delay tempo shifts were computed. Heel strike events were time warped to the same (median) latencies in step-delay and step-advance shift trials. Blue and pink lines and areas represent mean β band power as a function of trial latency and its 95% confidence interval. Only the right frontal cluster shows a significant difference between step advances and step delays (note the nonoverlapping confidence intervals).

