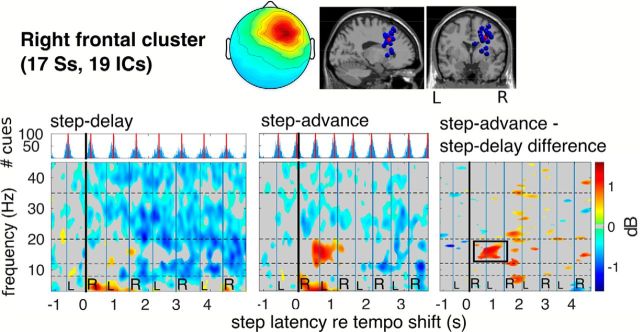
Figure 7.
Significant ERSP differences between adaptations to step-advance and step-delay tempo shifts for an IC cluster centered in right dorsolateral frontal cortex. Top, Mean scalp projection and equivalent dipole locations of cluster ICs. Bottom (above), Cue tone onset histograms and (below left, center) cluster-mean ERSP images for step-delay and step-advance trials, respectively, time-locked (0 s) to the right heel strike nearest to the first tempo-shifted cue tone, and (right) the difference between these two adaptation responses. Significance of condition differences was estimated using a bootstrap approach corrected for multiple comparisons using false discovery rate. Nonsignificant differences are masked in gray. The difference ERSP shows a stronger β band power increase near the second and third post-shift steps in the step-advance condition than in (subjectively easier) step-delay adaptations.

