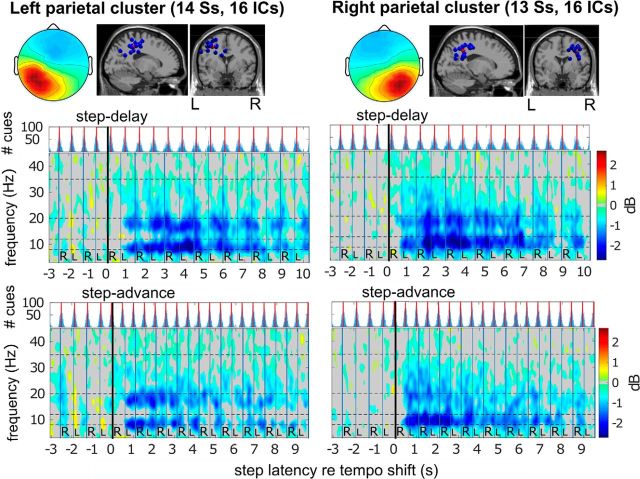
Figure 9.
Equivalent dipole source locations and cluster-mean scalp projections and ERSP images for IC source clusters in left and right parietal cortex. Cluster-mean ERSP images for step-delay and step-advance conditions were computed and visualized as in Figure 4. Single-trial spectrograms were time warped to median step latencies for heel strikes −7 to 15 before and after tempo shift onsets. ERSP images show long-lasting, shift-induced decreases in α and β band power maximal just before heel strikes of the foot contralateral to the cortical location.

