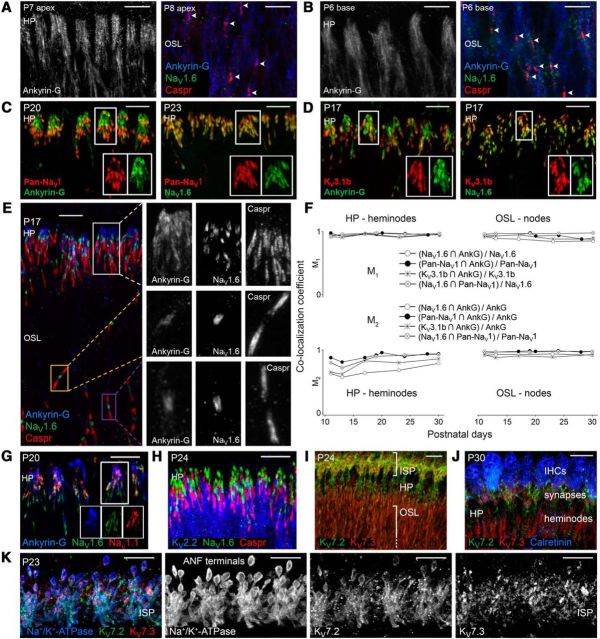
Figure 1.
Ion channel localization with ankyrin-G. A, B, Ankyrin-G aligned at the HP in the apical cochlea by P7 and in the basal turn by P6 as nodes developed (arrowheads). C, Pan-NaV1 colocalized with ankyrin-G and NaV1.6 near the HP. D, KV3.1b colocalized with ankyrin-G and NaV1.6. E, View of HP and distal OSL with enlargements in grayscale for heminodes at the HP (top row) and nodes in the OSL (bottom rows). F, M1 and M2 (top and bottom, respectively, see Materials and Methods) versus postnatal day for heminodes (left) and nodes (right) illustrate the development of colocalization. ROIs (n = 20–210 per data point) were determined by outlining regions near the HP (∼70 μm2) or OSL (∼4 μm2). SEM ranged from 0.00 to 0.03 (data not shown). Spatial overlap with ankyrin-G increased over development for Pan-NaV1, NaV1.6, and KV3.1b; M2, P30 > M2, P11, p < 10−4, Student's two-tailed t test. G, At heminodes, NaV1.1 partially overlapped NaV1.6 and ankyrin-G. H, KV2.2 expression extended from juxtaparanodes centrally. I–K, KV7.2 and KV7.3 expression in the OSL, at the HP, and in the ISP under IHCs. J, Calretinin-labeled IHCs. K, Na+/K+-ATPase-labeled ANF membranes. Scale bars, 10 μm.

