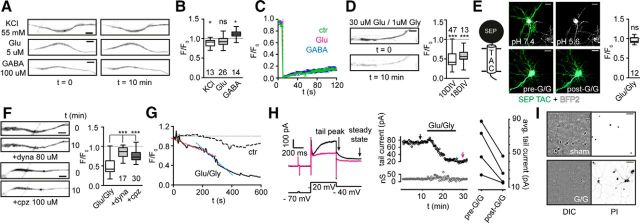
Figure 2.
Kv7.2/7.3 are highly stable at steady state and during neuronal stimulation but endocytose at high glutamate loads. A, Representative AIS images from neurons expressing SEP–TAC-7.3 and Kv7.2 before and after 10 min stimulation with 55 mm KCl, 5 μm Glu, or 100 μm GABA. B, Quantification of stimulation experiments. The number of cells included is indicated. *p < 0.05. C, Quantification of FRAP experiments performed in control (ctr), Glu, or GABA stimulated neurons. Presented as mean ± SEM, n = 17. D, Representative experiment (left) and quantification (right) of AIS SEP fluorescence in SEP–TAC-7.3- and Kv7.2- expressing 10 and 18 DIV neurons during 10 min treatment with 30 μm glutamate and 1 μm glycine (Glu/Gly). ***p < 0.0001. E, Illustration of SEP–TAC (left). Neurons expressing SEP–TAC (green) and mTagBFP2 (cell fill dye, white) were imaged at different pH (top; ensuring that SEP–TAC is cell surface expressed) and before/after Glu/Gly treatment (bottom). Quantification of Glu/Gly experiments (right). F, Representative images (left) and quantification (right) of SEP–TAC-7.3 fluorescence in Glu/Gly stimulated neurons pretreated with DMSO, 80 μm dynasore (dyna), or 100 μm chlorpromazine (cpz). ***p < 0.0001. G, Time course of SEP–TAC-7.3 fluorescence in representative control and Glu/Gly exposed neurons. Cells were imaged at 0.2 Hz for 10 min. The magneta- and blue-stapled lines indicate the rate shift. H, Left, Electrophysiological measurements of Kv7.2/7.3 currents in neurons expressing SEP–TAC-7.3 and Kv7.2 before (black trace) and after (magneta) Glu/Gly treatment. Middle, Top, Time course of tail current amplitude measured with 20 s trial intervals. Black and magneta arrows indicate traces shown to the left. Middle, Bottom, Changes in membrane conductance calculated with a 5 mV voltage-depolarizing step in the beginning of the voltage protocol. Right, Variations of average tail current amplitude before and after Glu/Gly exposure (n = 20 trial for each condition for each cell). I, PI staining of 10 DIV neurons 24 h after Glu/Gly (bottom) or sham (top) treatment. Differential interference contrast (DIC) images are shown left. Scale bars: A, D, F, 5 μm; E, 20 μm; I, 50 μm.

