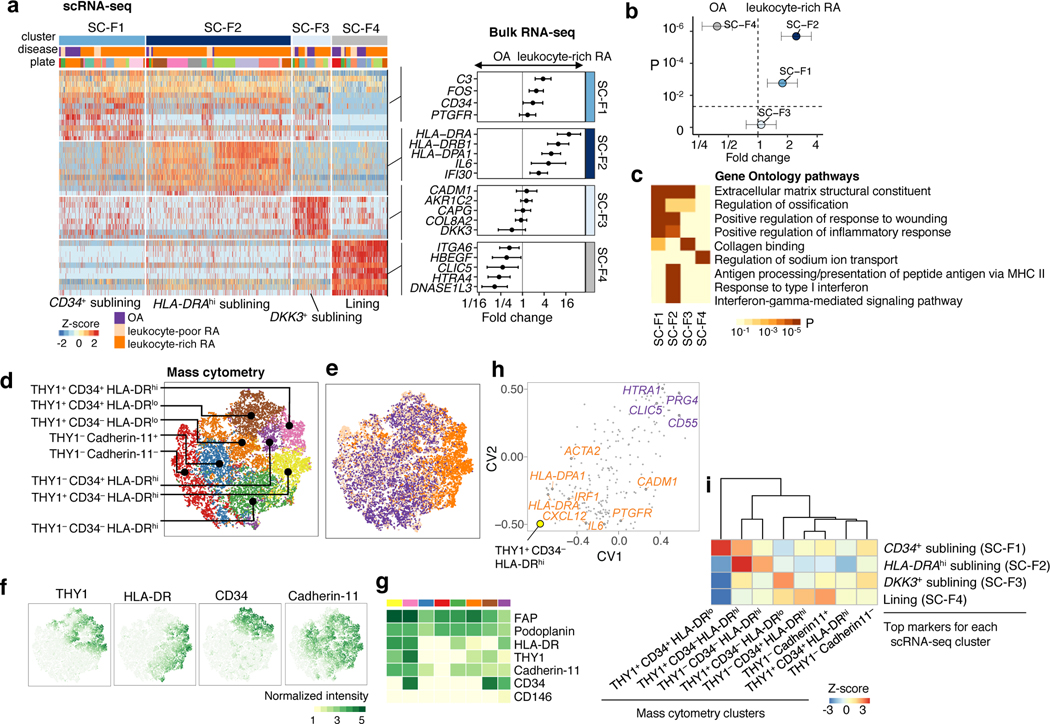
Figure 4.
Distinct synovial fibroblast subsets defined by cytokine activation and MHC II expression. a. scRNA-seq analysis identified three sublining subsets, CD34+ (SC-F1), HLAhi (SC-F2), and DKK3+ (SC-F3) and one lining subset (SC-F4). Differential analysis between leukocyte-rich RA (n = 16) and OA (n = 12) bulk RNA-seq fibroblast samples shows marker genes upregulated or downregulated in leukocyte-rich RA. Fold changes with 95% confidence interval (CI). b. By querying the leukocyte-rich RA (n = 16) and OA (n = 12) fibroblast bulk RNA-seq samples, scRNA-seq cluster HLA-DRAhi (SC-F2) and CD34+ (SC-F1) fibroblasts are significantly overabundant (two-sided Student’s t-test P=2×10⁻⁶, t-value=6.2, df = 23.91 and P=2×10⁻³, t-value = 3.20, df = 25.41, respectively) in leukocyte-rich RA relative to OA. Lining fibroblasts (SC-F4) are overabundant (two-sided Student’s t-test P=5×10⁻⁷, t-value=−5.31, df =21.97) in OA samples. Fold changes with 95% CI. c. Pathway enrichment analysis for each cluster. Two-sided Kolmogorov-Smirnov test with 105 permutations; Benjamini-Hochberg FDR is shown. d-e. Identified subpopulations from fibroblasts (n = 25,161) and disease status from 6 leukocyte-rich RA, 9 leukocyte-poor RA, and 8 OA by mass cytometry on the same gating with scRNA-seq. f-g. Normalized intensity of distinct protein markers shown in tSNE visualization and averaged for each cluster heatmap. h. CCA projections of mass cytometry clusters and bulk RNA-seq genes. First two canonical variates (CVs) separated genes upregulated in leukocyte-rich RA from genes upregulated in OA. HLAhi genes are highly associated with THY1+CD34−HLA-DRhi by mass cytometry. i. Integration of mass cytometry clusters with scRNA-seq clusters based on the top markers (AUC > 0.7) for each scRNA-seq cluster using top 10 canonical variates in the low-dimensional CCA space. We computed the spearman correlation between each pair of scRNA-seq cluster and mass cytometry cluster in the CCA space and performed permutation test 104 times. Z-score is calculated based on permutation p-value. We observed HLAhigh sublining fibroblasts by scRNA-seq are strongly correlated with THY1+CD34−HLA-DRhi fibroblasts by mass cytometry.

