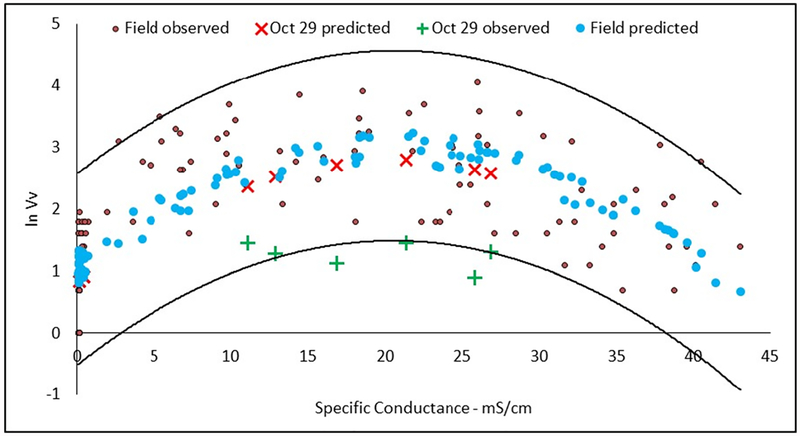
Fig. 4.
Natural log-transformed observed V vulnificus (Vv) during the seven regular monthly sampling trips in the Winyah Bay es-tuary, predicted Vv using the multiple regression model developed using data from the seven regular sampling trips, and observed and predicted Vv values from the October 29 special sampling. The solid lines are the 95% confidence interval

