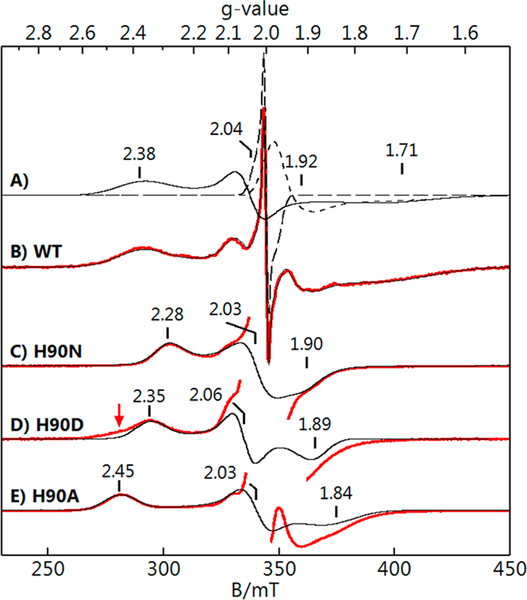
Figure 3.
EPR data (red) and simulations (black) of ~1 mM Tm FDPNO. (B) WT FDPNo and (C-E) FDPNO of H90 residue variants as listed. Principal components of the S = ½ g tensors are indicated. (A) Simulations of the individual species giving B: WT (solid line), radical impurity (long dash), free NO (short dash). Red arrow for H90D indicates a shoulder matching the H90A species. Conditions: temperature, 6 K; microwaves, 0.2 mW at 9.646 GHz. Simulations (black traces) use the parameters listed in Table 1.

