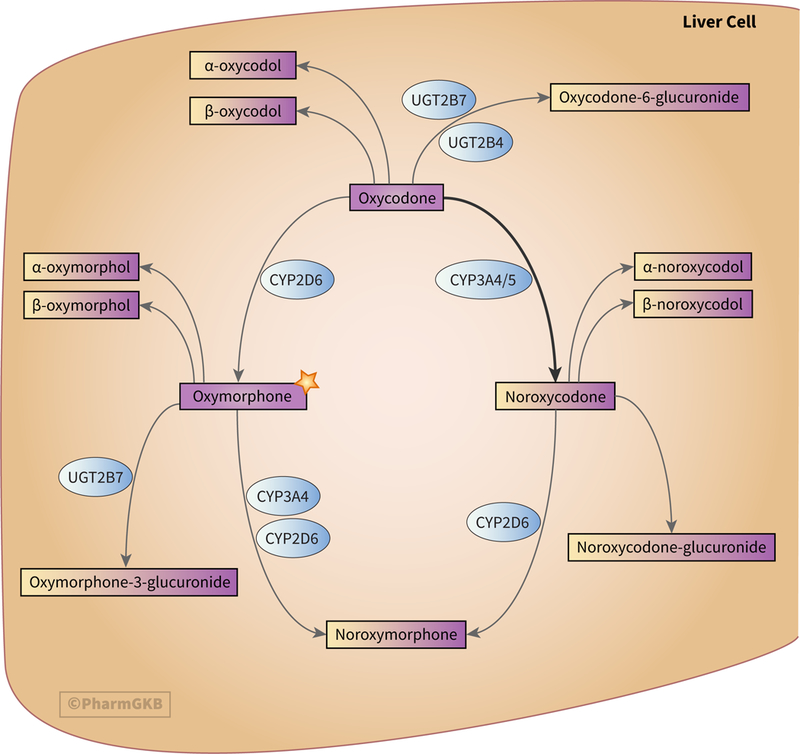
Figure 1.

Stylized diagram showing oxycodone metabolism in the liver. The star denotes the significance of oxymorphone as the only active metabolite of oxycodone and that it is itself used clinically. A fully clickable version of this figure can be found at https://www.pharmgkb.org/pathway/PA166170927.
