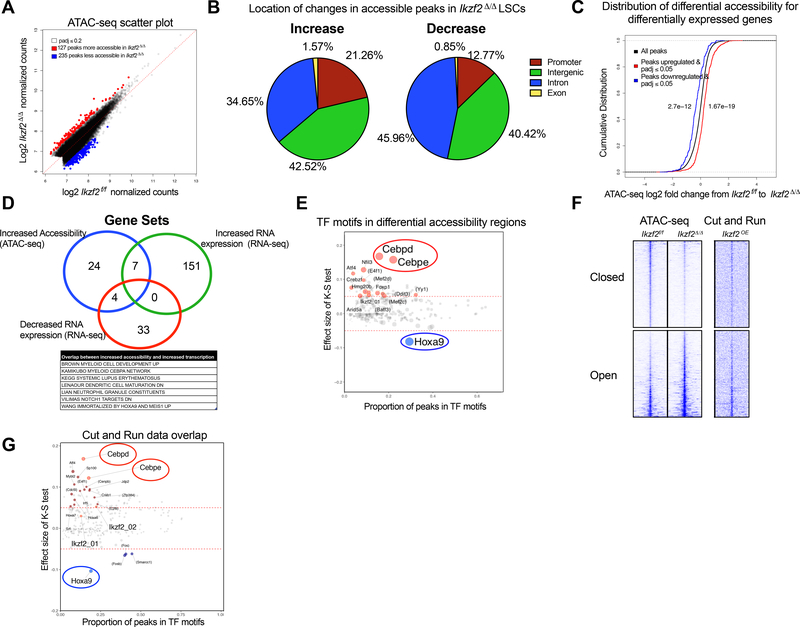
Figure 5. IKZF2 loss leads to increased accessibility of differentiation genes and decreased accessibility of self-renewal genes in LSCs.
(A) Scatterplot to show differentially accessible peaks from ATAC-seq analysis on Ikzf2f/f n=2 and Ikzf2Δ/Δ n=2 LSCs (c-Kit High) sorted from bone marrow of primary leukemic mice, under the Benjamini-Hochberg adjusted q-value threshold of 0.2. Red dots represent more accessible and blue represents less accessible peaks. (B) Location of increased accessible (left panel) and decreased accessible (right) ATAC-seq peaks in Ikzf2Δ/Δ LSCs. (C) Chromatin accessibility has positive correlation with gene expression. Cumulative distribution function (CDF) graph shows enrichment of accessibility in upregulated genes (shown in red) from the RNA sequencing data of Ikzf2f/f and Ikzf2Δ/ Δ LSCs. Loss of accessibility is found in downregulated genes (shown in blue). (D) Ikzf2 deletion results in increased accessibility and expression of myeloid differentiation program. Overlap of gene sets from genes with increased accessibility (ATAC-seq data), increased and decreased RNA expression (RNA-seq data) leading to seven gene sets including myeloid development, C/EBPα network, neutrophil maturation and gene set that is increased when Hoxa9 and Meis1 is upregulated. (E) TF motifs enriched in differentially accessible regions in Ikzf2Δ/Δ LSCs. C/EBPε and C/EBPδ motifs are the most enriched motifs in the increased accessible regions whereas HOXA9 motif is the top TF motif for loss of enrichment in decreased accessible regions in Ikzf2 deleted LSCs. Further information is found in STAR methods. (F) Tornado plot of differentially accessible ATAC-seq peaks (left) selected by nominal p ≤ 0.05. 1191 opened and 1523 closed peaks are shown. The genomic domain is defined as the summit ± 3 kb. To show the native binding of IKZF2, the signal of CUT&RUN sequencing at the same loci (right) is shown in parallel. (G) Data analyzed in (E) was further queried by additionally overlapping with genomic regions bound by IKZF2. TF motifs enriched in differentially accessible regions by the nominal p-value cutoff of 0.05 and showing averaged signal of IKZF2 CUT&RUN above 0.5 TPM over the region of summit ± 250 bp, encompassing 9259 peaks. TFs with the K-S test effect size above 0.05 and the odds ratio above 1.3 are highlighted with red (opened) and blue (closed) colors, respectively. The two IKZF2 motifs from TRANSFAC are also highlighted.

