Fig. 3.
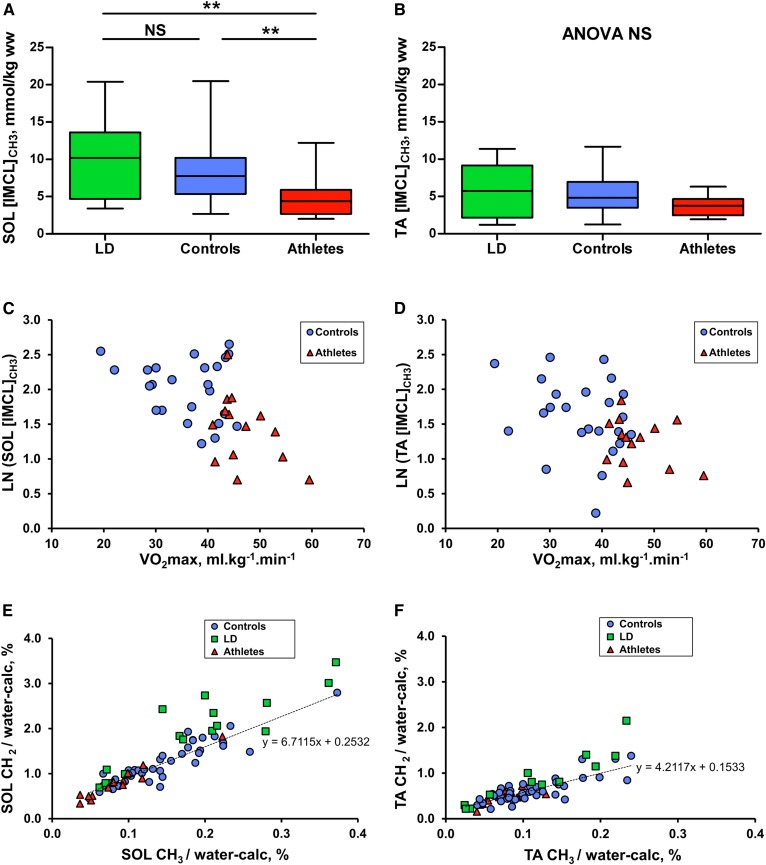
Composition-independent concentrations of IMCLs in LD subjects (green), controls (blue), and athletes (red). A, B: Box and whisker plots showing SOL and TA composition-independent IMCL concentration from the 1H MRS of methyl protons, as assessed by ANOVA and Games-Howell post hoc analyses. C, D: The relationship of SOL and TA composition-independent IMCL concentration with VO2max in a subset of participants who underwent VO2max testing, as assessed by Pearson’s correlation coefficient (controls: blue circles, n = 24; athletes: red triangles, n = 14). This was only significant when controls and athletes were combined (SOL: r = −0.52, P = 0.001; TA: r = −0.42, P = 0.009). E, F: SOL and TA IMCL CH2 and CH3 components. The values are expressed relative to the calculated water signal (water-calc), as described in Materials and Methods. The dotted line represents the linear regression line of the control data points. *P < 0.05, **P < 0.01, and ***P < 0.001.

